Immigrants from Trinidad and Tobago vs Soviet Union Doctorate Degree
COMPARE
Immigrants from Trinidad and Tobago
Soviet Union
Doctorate Degree
Doctorate Degree Comparison
Immigrants from Trinidad and Tobago
Soviet Union
1.5%
DOCTORATE DEGREE
0.5/ 100
METRIC RATING
271st/ 347
METRIC RANK
2.5%
DOCTORATE DEGREE
100.0/ 100
METRIC RATING
43rd/ 347
METRIC RANK
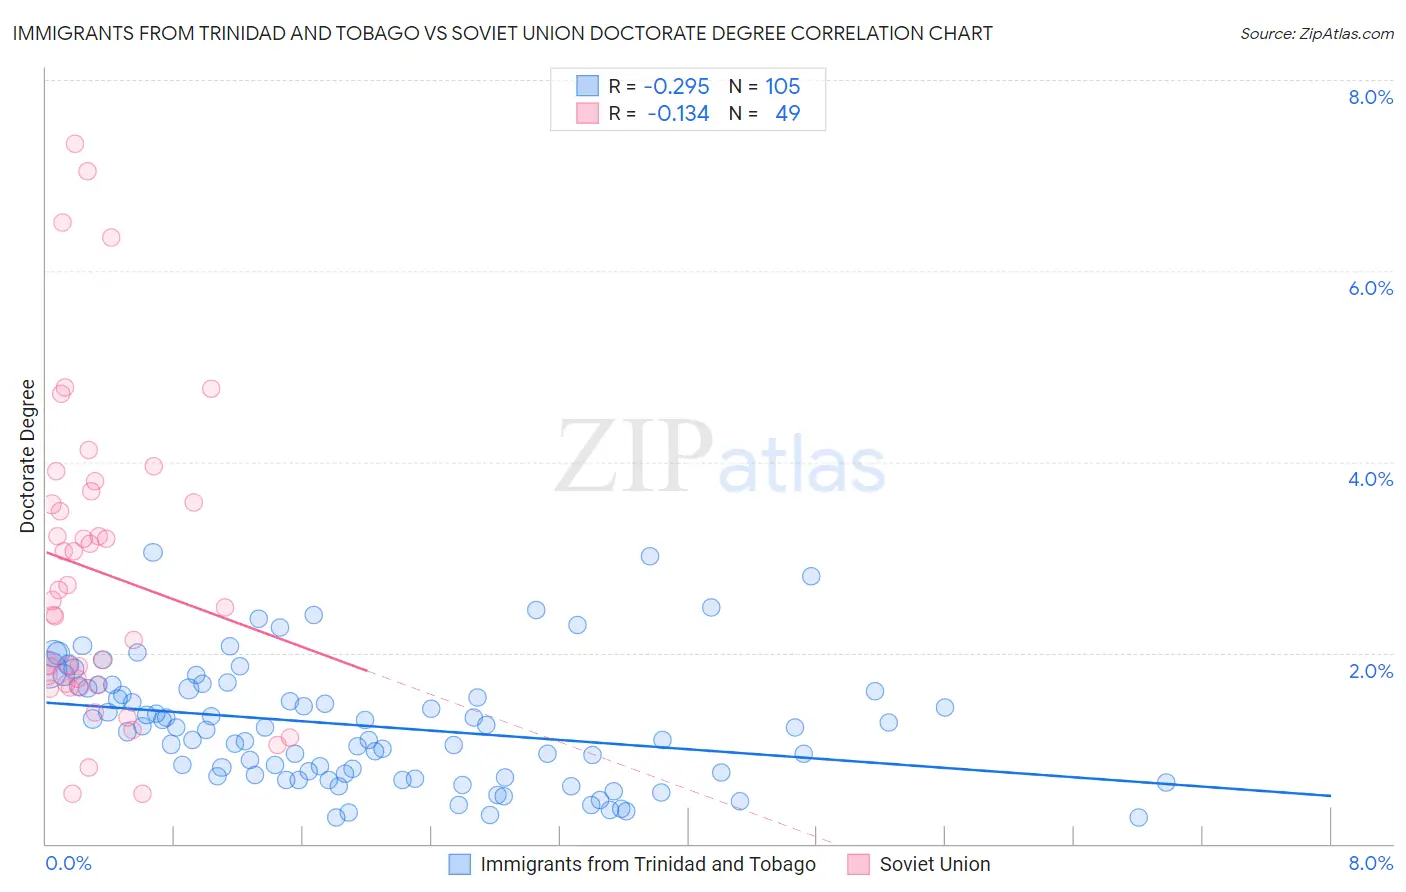
Immigrants from Trinidad and Tobago vs Soviet Union Doctorate Degree Correlation Chart
The statistical analysis conducted on geographies consisting of 222,674,417 people shows a weak negative correlation between the proportion of Immigrants from Trinidad and Tobago and percentage of population with at least doctorate degree education in the United States with a correlation coefficient (R) of -0.295 and weighted average of 1.5%. Similarly, the statistical analysis conducted on geographies consisting of 43,500,474 people shows a poor negative correlation between the proportion of Soviet Union and percentage of population with at least doctorate degree education in the United States with a correlation coefficient (R) of -0.134 and weighted average of 2.5%, a difference of 68.1%.
Doctorate Degree Correlation Summary
| Measurement | Immigrants from Trinidad and Tobago | Soviet Union |
| Minimum | 0.28% | 0.52% |
| Maximum | 3.0% | 7.3% |
| Range | 2.8% | 6.8% |
| Mean | 1.2% | 2.9% |
| Median | 1.2% | 2.5% |
| Interquartile 25% (IQ1) | 0.71% | 1.7% |
| Interquartile 75% (IQ3) | 1.6% | 3.6% |
| Interquartile Range (IQR) | 0.93% | 2.0% |
| Standard Deviation (Sample) | 0.63% | 1.6% |
| Standard Deviation (Population) | 0.63% | 1.6% |
Similar Demographics by Doctorate Degree
Demographics Similar to Immigrants from Trinidad and Tobago by Doctorate Degree
In terms of doctorate degree, the demographic groups most similar to Immigrants from Trinidad and Tobago are Salvadoran (1.5%, a difference of 0.070%), Immigrants from Barbados (1.5%, a difference of 0.090%), Crow (1.5%, a difference of 0.10%), Kiowa (1.5%, a difference of 0.19%), and U.S. Virgin Islander (1.5%, a difference of 0.19%).
| Demographics | Rating | Rank | Doctorate Degree |
| Blackfeet | 0.7 /100 | #264 | Tragic 1.5% |
| Nicaraguans | 0.6 /100 | #265 | Tragic 1.5% |
| Immigrants | Liberia | 0.5 /100 | #266 | Tragic 1.5% |
| Kiowa | 0.5 /100 | #267 | Tragic 1.5% |
| U.S. Virgin Islanders | 0.5 /100 | #268 | Tragic 1.5% |
| Crow | 0.5 /100 | #269 | Tragic 1.5% |
| Salvadorans | 0.5 /100 | #270 | Tragic 1.5% |
| Immigrants | Trinidad and Tobago | 0.5 /100 | #271 | Tragic 1.5% |
| Immigrants | Barbados | 0.4 /100 | #272 | Tragic 1.5% |
| Sioux | 0.4 /100 | #273 | Tragic 1.5% |
| Yaqui | 0.4 /100 | #274 | Tragic 1.5% |
| Aleuts | 0.4 /100 | #275 | Tragic 1.5% |
| Paiute | 0.4 /100 | #276 | Tragic 1.5% |
| Bahamians | 0.4 /100 | #277 | Tragic 1.5% |
| Hawaiians | 0.4 /100 | #278 | Tragic 1.5% |
Demographics Similar to Soviet Union by Doctorate Degree
In terms of doctorate degree, the demographic groups most similar to Soviet Union are Immigrants from Netherlands (2.5%, a difference of 0.040%), New Zealander (2.5%, a difference of 0.94%), Immigrants from South Africa (2.4%, a difference of 1.5%), Immigrants from Russia (2.5%, a difference of 1.6%), and Immigrants from Austria (2.4%, a difference of 1.7%).
| Demographics | Rating | Rank | Doctorate Degree |
| Immigrants | Spain | 100.0 /100 | #36 | Exceptional 2.6% |
| Immigrants | Kuwait | 100.0 /100 | #37 | Exceptional 2.6% |
| Russians | 100.0 /100 | #38 | Exceptional 2.6% |
| Immigrants | Ireland | 100.0 /100 | #39 | Exceptional 2.5% |
| Estonians | 100.0 /100 | #40 | Exceptional 2.5% |
| Immigrants | Russia | 100.0 /100 | #41 | Exceptional 2.5% |
| New Zealanders | 100.0 /100 | #42 | Exceptional 2.5% |
| Soviet Union | 100.0 /100 | #43 | Exceptional 2.5% |
| Immigrants | Netherlands | 100.0 /100 | #44 | Exceptional 2.5% |
| Immigrants | South Africa | 100.0 /100 | #45 | Exceptional 2.4% |
| Immigrants | Austria | 100.0 /100 | #46 | Exceptional 2.4% |
| Immigrants | Western Europe | 100.0 /100 | #47 | Exceptional 2.4% |
| Asians | 100.0 /100 | #48 | Exceptional 2.4% |
| Immigrants | Asia | 100.0 /100 | #49 | Exceptional 2.4% |
| Immigrants | Norway | 100.0 /100 | #50 | Exceptional 2.4% |