Italian vs Soviet Union Doctorate Degree
COMPARE
Italian
Soviet Union
Doctorate Degree
Doctorate Degree Comparison
Italians
Soviet Union
2.0%
DOCTORATE DEGREE
86.0/ 100
METRIC RATING
142nd/ 347
METRIC RANK
2.5%
DOCTORATE DEGREE
100.0/ 100
METRIC RATING
43rd/ 347
METRIC RANK
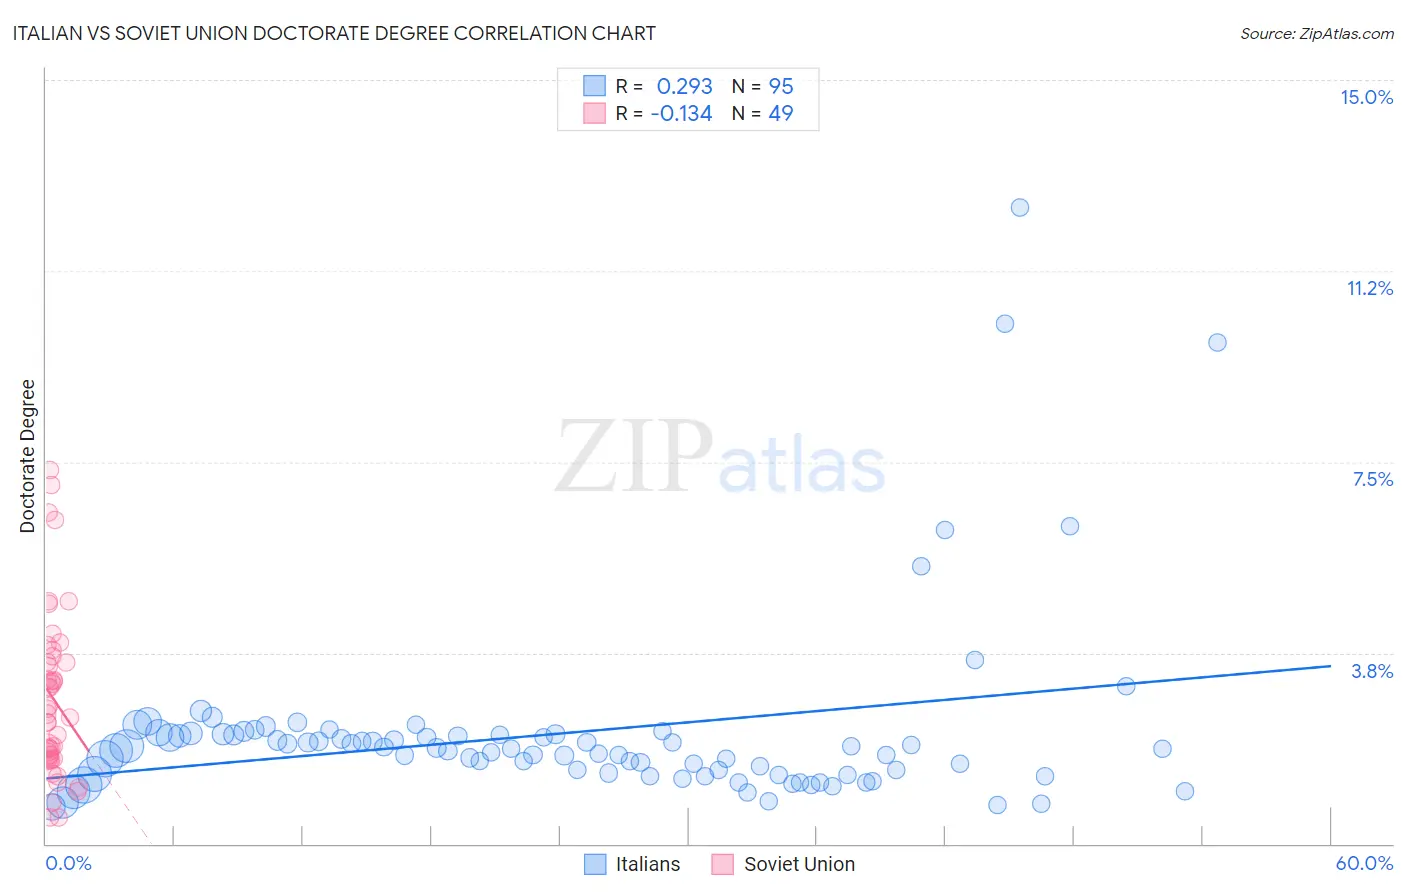
Italian vs Soviet Union Doctorate Degree Correlation Chart
The statistical analysis conducted on geographies consisting of 549,362,939 people shows a weak positive correlation between the proportion of Italians and percentage of population with at least doctorate degree education in the United States with a correlation coefficient (R) of 0.293 and weighted average of 2.0%. Similarly, the statistical analysis conducted on geographies consisting of 43,500,474 people shows a poor negative correlation between the proportion of Soviet Union and percentage of population with at least doctorate degree education in the United States with a correlation coefficient (R) of -0.134 and weighted average of 2.5%, a difference of 26.5%.
Doctorate Degree Correlation Summary
| Measurement | Italian | Soviet Union |
| Minimum | 0.72% | 0.52% |
| Maximum | 12.5% | 7.3% |
| Range | 11.8% | 6.8% |
| Mean | 2.2% | 2.9% |
| Median | 1.9% | 2.5% |
| Interquartile 25% (IQ1) | 1.4% | 1.7% |
| Interquartile 75% (IQ3) | 2.1% | 3.6% |
| Interquartile Range (IQR) | 0.77% | 2.0% |
| Standard Deviation (Sample) | 1.8% | 1.6% |
| Standard Deviation (Population) | 1.8% | 1.6% |
Similar Demographics by Doctorate Degree
Demographics Similar to Italians by Doctorate Degree
In terms of doctorate degree, the demographic groups most similar to Italians are Senegalese (2.0%, a difference of 0.21%), Sierra Leonean (2.0%, a difference of 0.25%), Immigrants from Africa (2.0%, a difference of 0.28%), Afghan (2.0%, a difference of 0.36%), and Immigrants from Moldova (2.0%, a difference of 0.46%).
| Demographics | Rating | Rank | Doctorate Degree |
| Serbians | 88.7 /100 | #135 | Excellent 2.0% |
| Swedes | 88.3 /100 | #136 | Excellent 2.0% |
| South American Indians | 88.3 /100 | #137 | Excellent 2.0% |
| Swiss | 88.0 /100 | #138 | Excellent 2.0% |
| Afghans | 87.2 /100 | #139 | Excellent 2.0% |
| Immigrants | Africa | 87.0 /100 | #140 | Excellent 2.0% |
| Senegalese | 86.7 /100 | #141 | Excellent 2.0% |
| Italians | 86.0 /100 | #142 | Excellent 2.0% |
| Sierra Leoneans | 85.1 /100 | #143 | Excellent 2.0% |
| Immigrants | Moldova | 84.3 /100 | #144 | Excellent 2.0% |
| Kenyans | 83.6 /100 | #145 | Excellent 1.9% |
| Immigrants | Syria | 83.6 /100 | #146 | Excellent 1.9% |
| Immigrants | Senegal | 82.5 /100 | #147 | Excellent 1.9% |
| Luxembourgers | 81.1 /100 | #148 | Excellent 1.9% |
| Basques | 76.9 /100 | #149 | Good 1.9% |
Demographics Similar to Soviet Union by Doctorate Degree
In terms of doctorate degree, the demographic groups most similar to Soviet Union are Immigrants from Netherlands (2.5%, a difference of 0.040%), New Zealander (2.5%, a difference of 0.94%), Immigrants from South Africa (2.4%, a difference of 1.5%), Immigrants from Russia (2.5%, a difference of 1.6%), and Immigrants from Austria (2.4%, a difference of 1.7%).
| Demographics | Rating | Rank | Doctorate Degree |
| Immigrants | Spain | 100.0 /100 | #36 | Exceptional 2.6% |
| Immigrants | Kuwait | 100.0 /100 | #37 | Exceptional 2.6% |
| Russians | 100.0 /100 | #38 | Exceptional 2.6% |
| Immigrants | Ireland | 100.0 /100 | #39 | Exceptional 2.5% |
| Estonians | 100.0 /100 | #40 | Exceptional 2.5% |
| Immigrants | Russia | 100.0 /100 | #41 | Exceptional 2.5% |
| New Zealanders | 100.0 /100 | #42 | Exceptional 2.5% |
| Soviet Union | 100.0 /100 | #43 | Exceptional 2.5% |
| Immigrants | Netherlands | 100.0 /100 | #44 | Exceptional 2.5% |
| Immigrants | South Africa | 100.0 /100 | #45 | Exceptional 2.4% |
| Immigrants | Austria | 100.0 /100 | #46 | Exceptional 2.4% |
| Immigrants | Western Europe | 100.0 /100 | #47 | Exceptional 2.4% |
| Asians | 100.0 /100 | #48 | Exceptional 2.4% |
| Immigrants | Asia | 100.0 /100 | #49 | Exceptional 2.4% |
| Immigrants | Norway | 100.0 /100 | #50 | Exceptional 2.4% |