Yuman vs Soviet Union Doctorate Degree
COMPARE
Yuman
Soviet Union
Doctorate Degree
Doctorate Degree Comparison
Yuman
Soviet Union
1.5%
DOCTORATE DEGREE
1.1/ 100
METRIC RATING
252nd/ 347
METRIC RANK
2.5%
DOCTORATE DEGREE
100.0/ 100
METRIC RATING
43rd/ 347
METRIC RANK
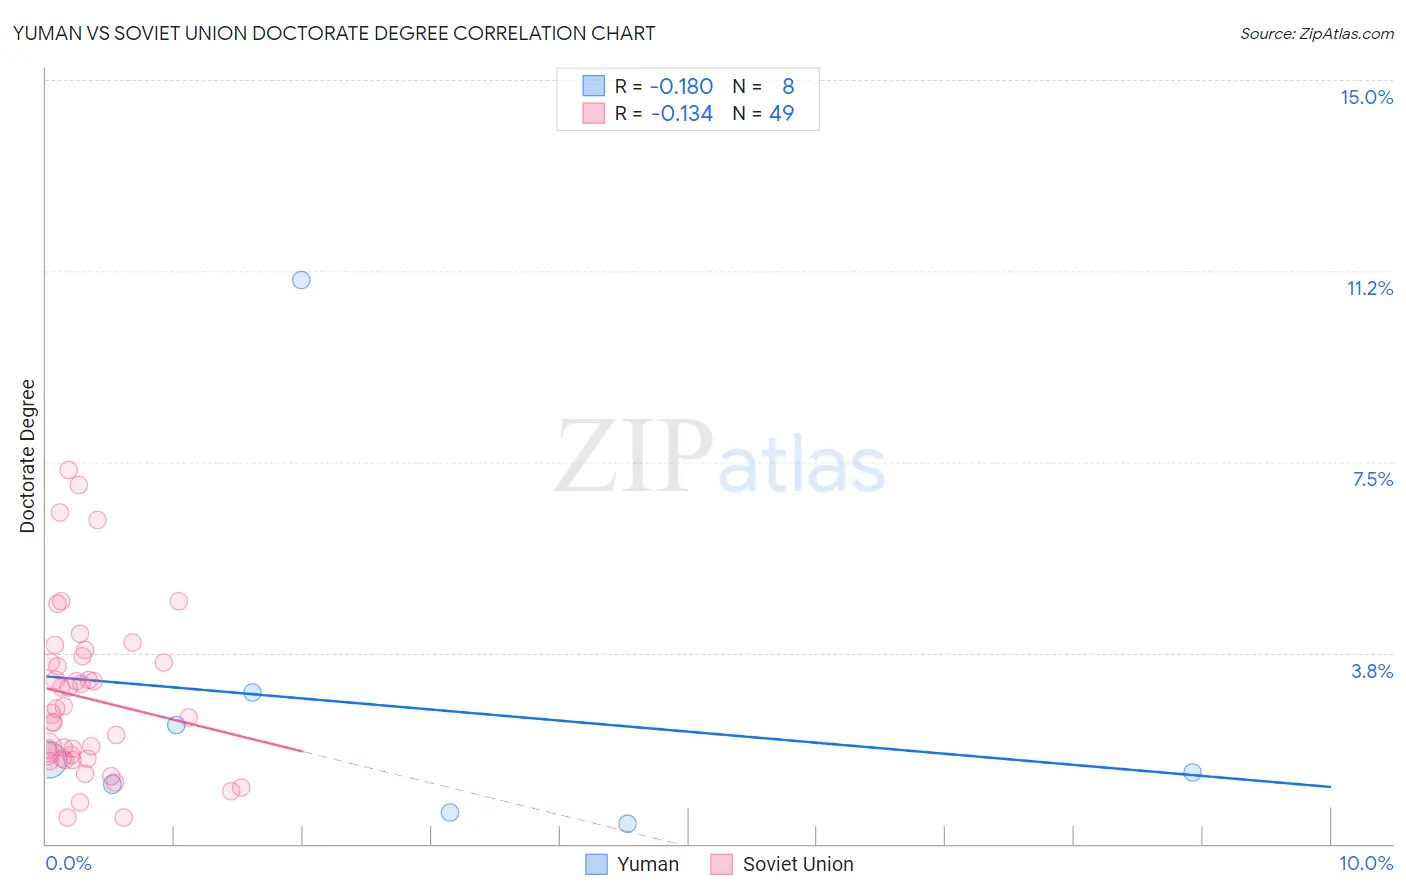
Yuman vs Soviet Union Doctorate Degree Correlation Chart
The statistical analysis conducted on geographies consisting of 40,365,852 people shows a poor negative correlation between the proportion of Yuman and percentage of population with at least doctorate degree education in the United States with a correlation coefficient (R) of -0.180 and weighted average of 1.5%. Similarly, the statistical analysis conducted on geographies consisting of 43,500,474 people shows a poor negative correlation between the proportion of Soviet Union and percentage of population with at least doctorate degree education in the United States with a correlation coefficient (R) of -0.134 and weighted average of 2.5%, a difference of 61.9%.
Doctorate Degree Correlation Summary
| Measurement | Yuman | Soviet Union |
| Minimum | 0.38% | 0.52% |
| Maximum | 11.1% | 7.3% |
| Range | 10.7% | 6.8% |
| Mean | 2.7% | 2.9% |
| Median | 1.5% | 2.5% |
| Interquartile 25% (IQ1) | 0.89% | 1.7% |
| Interquartile 75% (IQ3) | 2.7% | 3.6% |
| Interquartile Range (IQR) | 1.8% | 2.0% |
| Standard Deviation (Sample) | 3.5% | 1.6% |
| Standard Deviation (Population) | 3.3% | 1.6% |
Similar Demographics by Doctorate Degree
Demographics Similar to Yuman by Doctorate Degree
In terms of doctorate degree, the demographic groups most similar to Yuman are American (1.5%, a difference of 0.15%), Immigrants from Cambodia (1.5%, a difference of 0.28%), Trinidadian and Tobagonian (1.5%, a difference of 0.28%), Central American Indian (1.5%, a difference of 0.33%), and Chippewa (1.5%, a difference of 0.55%).
| Demographics | Rating | Rank | Doctorate Degree |
| Delaware | 1.9 /100 | #245 | Tragic 1.6% |
| Hmong | 1.8 /100 | #246 | Tragic 1.6% |
| Comanche | 1.8 /100 | #247 | Tragic 1.6% |
| Africans | 1.8 /100 | #248 | Tragic 1.6% |
| Potawatomi | 1.6 /100 | #249 | Tragic 1.6% |
| Immigrants | Fiji | 1.6 /100 | #250 | Tragic 1.6% |
| Apache | 1.3 /100 | #251 | Tragic 1.5% |
| Yuman | 1.1 /100 | #252 | Tragic 1.5% |
| Americans | 1.0 /100 | #253 | Tragic 1.5% |
| Immigrants | Cambodia | 1.0 /100 | #254 | Tragic 1.5% |
| Trinidadians and Tobagonians | 1.0 /100 | #255 | Tragic 1.5% |
| Central American Indians | 1.0 /100 | #256 | Tragic 1.5% |
| Chippewa | 0.9 /100 | #257 | Tragic 1.5% |
| Immigrants | West Indies | 0.9 /100 | #258 | Tragic 1.5% |
| Liberians | 0.9 /100 | #259 | Tragic 1.5% |
Demographics Similar to Soviet Union by Doctorate Degree
In terms of doctorate degree, the demographic groups most similar to Soviet Union are Immigrants from Netherlands (2.5%, a difference of 0.040%), New Zealander (2.5%, a difference of 0.94%), Immigrants from South Africa (2.4%, a difference of 1.5%), Immigrants from Russia (2.5%, a difference of 1.6%), and Immigrants from Austria (2.4%, a difference of 1.7%).
| Demographics | Rating | Rank | Doctorate Degree |
| Immigrants | Spain | 100.0 /100 | #36 | Exceptional 2.6% |
| Immigrants | Kuwait | 100.0 /100 | #37 | Exceptional 2.6% |
| Russians | 100.0 /100 | #38 | Exceptional 2.6% |
| Immigrants | Ireland | 100.0 /100 | #39 | Exceptional 2.5% |
| Estonians | 100.0 /100 | #40 | Exceptional 2.5% |
| Immigrants | Russia | 100.0 /100 | #41 | Exceptional 2.5% |
| New Zealanders | 100.0 /100 | #42 | Exceptional 2.5% |
| Soviet Union | 100.0 /100 | #43 | Exceptional 2.5% |
| Immigrants | Netherlands | 100.0 /100 | #44 | Exceptional 2.5% |
| Immigrants | South Africa | 100.0 /100 | #45 | Exceptional 2.4% |
| Immigrants | Austria | 100.0 /100 | #46 | Exceptional 2.4% |
| Immigrants | Western Europe | 100.0 /100 | #47 | Exceptional 2.4% |
| Asians | 100.0 /100 | #48 | Exceptional 2.4% |
| Immigrants | Asia | 100.0 /100 | #49 | Exceptional 2.4% |
| Immigrants | Norway | 100.0 /100 | #50 | Exceptional 2.4% |