Immigrants from Haiti vs Immigrants from Afghanistan Doctorate Degree
COMPARE
Immigrants from Haiti
Immigrants from Afghanistan
Doctorate Degree
Doctorate Degree Comparison
Immigrants from Haiti
Immigrants from Afghanistan
1.3%
DOCTORATE DEGREE
0.0/ 100
METRIC RATING
335th/ 347
METRIC RANK
1.8%
DOCTORATE DEGREE
44.3/ 100
METRIC RATING
182nd/ 347
METRIC RANK
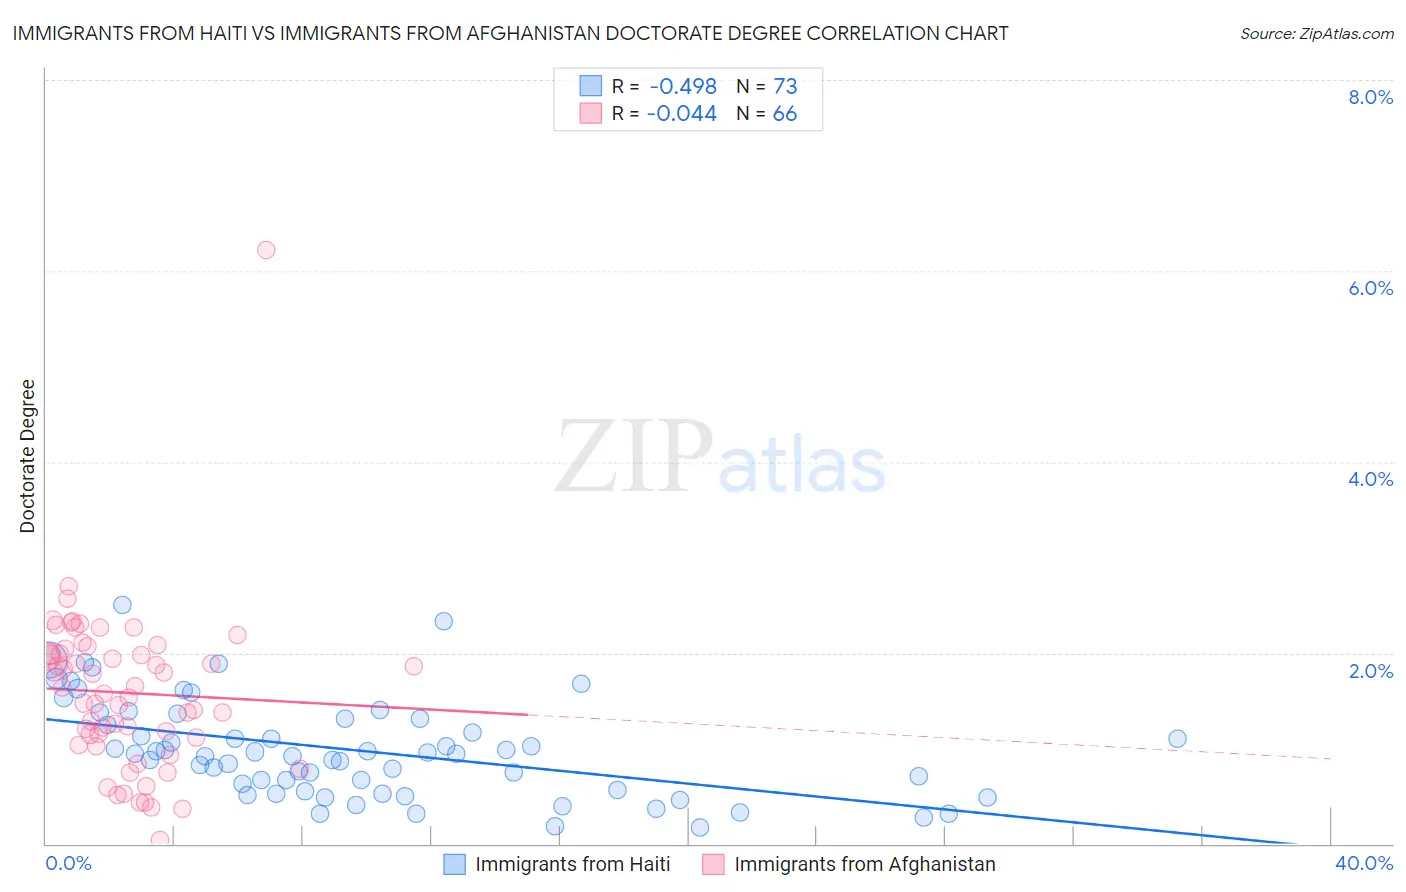
Immigrants from Haiti vs Immigrants from Afghanistan Doctorate Degree Correlation Chart
The statistical analysis conducted on geographies consisting of 224,109,380 people shows a moderate negative correlation between the proportion of Immigrants from Haiti and percentage of population with at least doctorate degree education in the United States with a correlation coefficient (R) of -0.498 and weighted average of 1.3%. Similarly, the statistical analysis conducted on geographies consisting of 147,399,207 people shows no correlation between the proportion of Immigrants from Afghanistan and percentage of population with at least doctorate degree education in the United States with a correlation coefficient (R) of -0.044 and weighted average of 1.8%, a difference of 45.1%.
Doctorate Degree Correlation Summary
| Measurement | Immigrants from Haiti | Immigrants from Afghanistan |
| Minimum | 0.17% | 0.038% |
| Maximum | 2.5% | 6.2% |
| Range | 2.3% | 6.2% |
| Mean | 0.98% | 1.6% |
| Median | 0.94% | 1.6% |
| Interquartile 25% (IQ1) | 0.56% | 1.1% |
| Interquartile 75% (IQ3) | 1.3% | 2.0% |
| Interquartile Range (IQR) | 0.75% | 0.88% |
| Standard Deviation (Sample) | 0.51% | 0.86% |
| Standard Deviation (Population) | 0.51% | 0.85% |
Similar Demographics by Doctorate Degree
Demographics Similar to Immigrants from Haiti by Doctorate Degree
In terms of doctorate degree, the demographic groups most similar to Immigrants from Haiti are Nepalese (1.3%, a difference of 0.23%), Immigrants from Dominican Republic (1.3%, a difference of 1.8%), Immigrants from Caribbean (1.3%, a difference of 2.0%), Yakama (1.3%, a difference of 2.1%), and Bangladeshi (1.2%, a difference of 3.7%).
| Demographics | Rating | Rank | Doctorate Degree |
| Inupiat | 0.0 /100 | #328 | Tragic 1.3% |
| Haitians | 0.0 /100 | #329 | Tragic 1.3% |
| Yup'ik | 0.0 /100 | #330 | Tragic 1.3% |
| Immigrants | Latin America | 0.0 /100 | #331 | Tragic 1.3% |
| Yakama | 0.0 /100 | #332 | Tragic 1.3% |
| Immigrants | Caribbean | 0.0 /100 | #333 | Tragic 1.3% |
| Immigrants | Dominican Republic | 0.0 /100 | #334 | Tragic 1.3% |
| Immigrants | Haiti | 0.0 /100 | #335 | Tragic 1.3% |
| Nepalese | 0.0 /100 | #336 | Tragic 1.3% |
| Bangladeshis | 0.0 /100 | #337 | Tragic 1.2% |
| Puget Sound Salish | 0.0 /100 | #338 | Tragic 1.2% |
| Immigrants | Central America | 0.0 /100 | #339 | Tragic 1.2% |
| Immigrants | Cuba | 0.0 /100 | #340 | Tragic 1.2% |
| Mexicans | 0.0 /100 | #341 | Tragic 1.2% |
| Arapaho | 0.0 /100 | #342 | Tragic 1.2% |
Demographics Similar to Immigrants from Afghanistan by Doctorate Degree
In terms of doctorate degree, the demographic groups most similar to Immigrants from Afghanistan are Immigrants (1.8%, a difference of 0.29%), Finnish (1.8%, a difference of 0.34%), Scandinavian (1.8%, a difference of 0.55%), Ghanaian (1.8%, a difference of 0.60%), and Nigerian (1.8%, a difference of 0.66%).
| Demographics | Rating | Rank | Doctorate Degree |
| Immigrants | Thailand | 49.4 /100 | #175 | Average 1.8% |
| Spanish | 49.3 /100 | #176 | Average 1.8% |
| Iraqis | 49.2 /100 | #177 | Average 1.8% |
| French | 48.8 /100 | #178 | Average 1.8% |
| Ghanaians | 48.3 /100 | #179 | Average 1.8% |
| Scandinavians | 48.0 /100 | #180 | Average 1.8% |
| Immigrants | Immigrants | 46.2 /100 | #181 | Average 1.8% |
| Immigrants | Afghanistan | 44.3 /100 | #182 | Average 1.8% |
| Finns | 42.1 /100 | #183 | Average 1.8% |
| Nigerians | 39.9 /100 | #184 | Fair 1.8% |
| Slovaks | 36.4 /100 | #185 | Fair 1.8% |
| Peruvians | 34.4 /100 | #186 | Fair 1.8% |
| Czechoslovakians | 33.0 /100 | #187 | Fair 1.8% |
| Germans | 30.5 /100 | #188 | Fair 1.8% |
| French Canadians | 30.2 /100 | #189 | Fair 1.8% |