Immigrants from Haiti vs Samoan Doctorate Degree
COMPARE
Immigrants from Haiti
Samoan
Doctorate Degree
Doctorate Degree Comparison
Immigrants from Haiti
Samoans
1.3%
DOCTORATE DEGREE
0.0/ 100
METRIC RATING
335th/ 347
METRIC RANK
1.4%
DOCTORATE DEGREE
0.2/ 100
METRIC RATING
294th/ 347
METRIC RANK
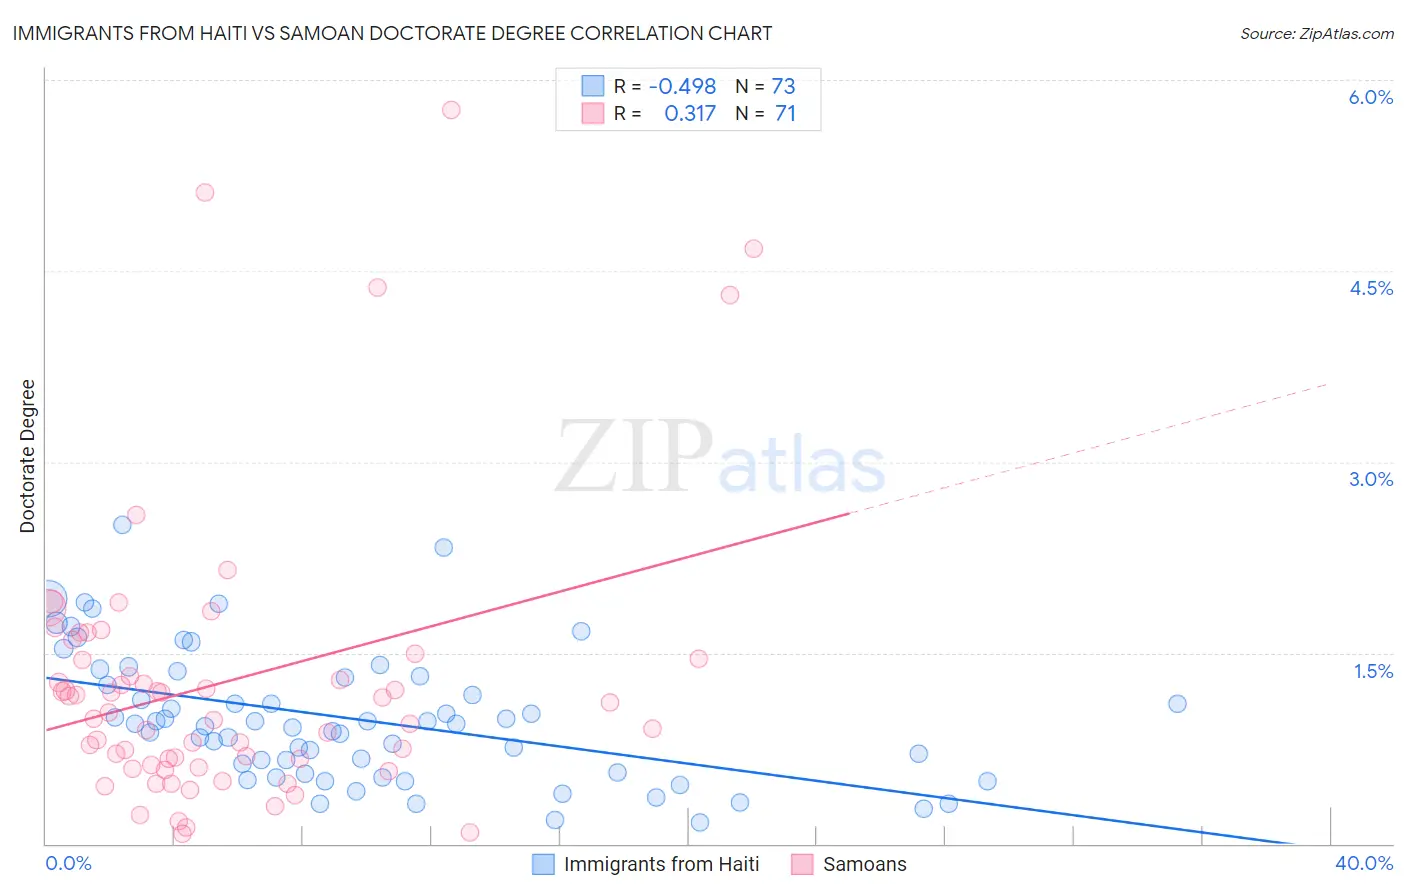
Immigrants from Haiti vs Samoan Doctorate Degree Correlation Chart
The statistical analysis conducted on geographies consisting of 224,109,380 people shows a moderate negative correlation between the proportion of Immigrants from Haiti and percentage of population with at least doctorate degree education in the United States with a correlation coefficient (R) of -0.498 and weighted average of 1.3%. Similarly, the statistical analysis conducted on geographies consisting of 223,690,736 people shows a mild positive correlation between the proportion of Samoans and percentage of population with at least doctorate degree education in the United States with a correlation coefficient (R) of 0.317 and weighted average of 1.4%, a difference of 13.2%.
Doctorate Degree Correlation Summary
| Measurement | Immigrants from Haiti | Samoan |
| Minimum | 0.17% | 0.079% |
| Maximum | 2.5% | 5.8% |
| Range | 2.3% | 5.7% |
| Mean | 0.98% | 1.3% |
| Median | 0.94% | 1.0% |
| Interquartile 25% (IQ1) | 0.56% | 0.61% |
| Interquartile 75% (IQ3) | 1.3% | 1.4% |
| Interquartile Range (IQR) | 0.75% | 0.83% |
| Standard Deviation (Sample) | 0.51% | 1.1% |
| Standard Deviation (Population) | 0.51% | 1.1% |
Similar Demographics by Doctorate Degree
Demographics Similar to Immigrants from Haiti by Doctorate Degree
In terms of doctorate degree, the demographic groups most similar to Immigrants from Haiti are Nepalese (1.3%, a difference of 0.23%), Immigrants from Dominican Republic (1.3%, a difference of 1.8%), Immigrants from Caribbean (1.3%, a difference of 2.0%), Yakama (1.3%, a difference of 2.1%), and Bangladeshi (1.2%, a difference of 3.7%).
| Demographics | Rating | Rank | Doctorate Degree |
| Inupiat | 0.0 /100 | #328 | Tragic 1.3% |
| Haitians | 0.0 /100 | #329 | Tragic 1.3% |
| Yup'ik | 0.0 /100 | #330 | Tragic 1.3% |
| Immigrants | Latin America | 0.0 /100 | #331 | Tragic 1.3% |
| Yakama | 0.0 /100 | #332 | Tragic 1.3% |
| Immigrants | Caribbean | 0.0 /100 | #333 | Tragic 1.3% |
| Immigrants | Dominican Republic | 0.0 /100 | #334 | Tragic 1.3% |
| Immigrants | Haiti | 0.0 /100 | #335 | Tragic 1.3% |
| Nepalese | 0.0 /100 | #336 | Tragic 1.3% |
| Bangladeshis | 0.0 /100 | #337 | Tragic 1.2% |
| Puget Sound Salish | 0.0 /100 | #338 | Tragic 1.2% |
| Immigrants | Central America | 0.0 /100 | #339 | Tragic 1.2% |
| Immigrants | Cuba | 0.0 /100 | #340 | Tragic 1.2% |
| Mexicans | 0.0 /100 | #341 | Tragic 1.2% |
| Arapaho | 0.0 /100 | #342 | Tragic 1.2% |
Demographics Similar to Samoans by Doctorate Degree
In terms of doctorate degree, the demographic groups most similar to Samoans are Guatemalan (1.4%, a difference of 0.70%), Immigrants from Yemen (1.4%, a difference of 0.71%), Immigrants from Ecuador (1.4%, a difference of 0.94%), Tsimshian (1.4%, a difference of 1.1%), and Alaska Native (1.4%, a difference of 1.3%).
| Demographics | Rating | Rank | Doctorate Degree |
| Cajuns | 0.3 /100 | #287 | Tragic 1.5% |
| Immigrants | El Salvador | 0.3 /100 | #288 | Tragic 1.4% |
| Cape Verdeans | 0.3 /100 | #289 | Tragic 1.4% |
| Choctaw | 0.3 /100 | #290 | Tragic 1.4% |
| Blacks/African Americans | 0.3 /100 | #291 | Tragic 1.4% |
| Alaska Natives | 0.3 /100 | #292 | Tragic 1.4% |
| Immigrants | Yemen | 0.2 /100 | #293 | Tragic 1.4% |
| Samoans | 0.2 /100 | #294 | Tragic 1.4% |
| Guatemalans | 0.2 /100 | #295 | Tragic 1.4% |
| Immigrants | Ecuador | 0.2 /100 | #296 | Tragic 1.4% |
| Tsimshian | 0.2 /100 | #297 | Tragic 1.4% |
| Puerto Ricans | 0.1 /100 | #298 | Tragic 1.4% |
| Belizeans | 0.1 /100 | #299 | Tragic 1.4% |
| Immigrants | Guatemala | 0.1 /100 | #300 | Tragic 1.4% |
| Hondurans | 0.1 /100 | #301 | Tragic 1.4% |