Peruvian vs Soviet Union Doctorate Degree
COMPARE
Peruvian
Soviet Union
Doctorate Degree
Doctorate Degree Comparison
Peruvians
Soviet Union
1.8%
DOCTORATE DEGREE
34.4/ 100
METRIC RATING
186th/ 347
METRIC RANK
2.5%
DOCTORATE DEGREE
100.0/ 100
METRIC RATING
43rd/ 347
METRIC RANK
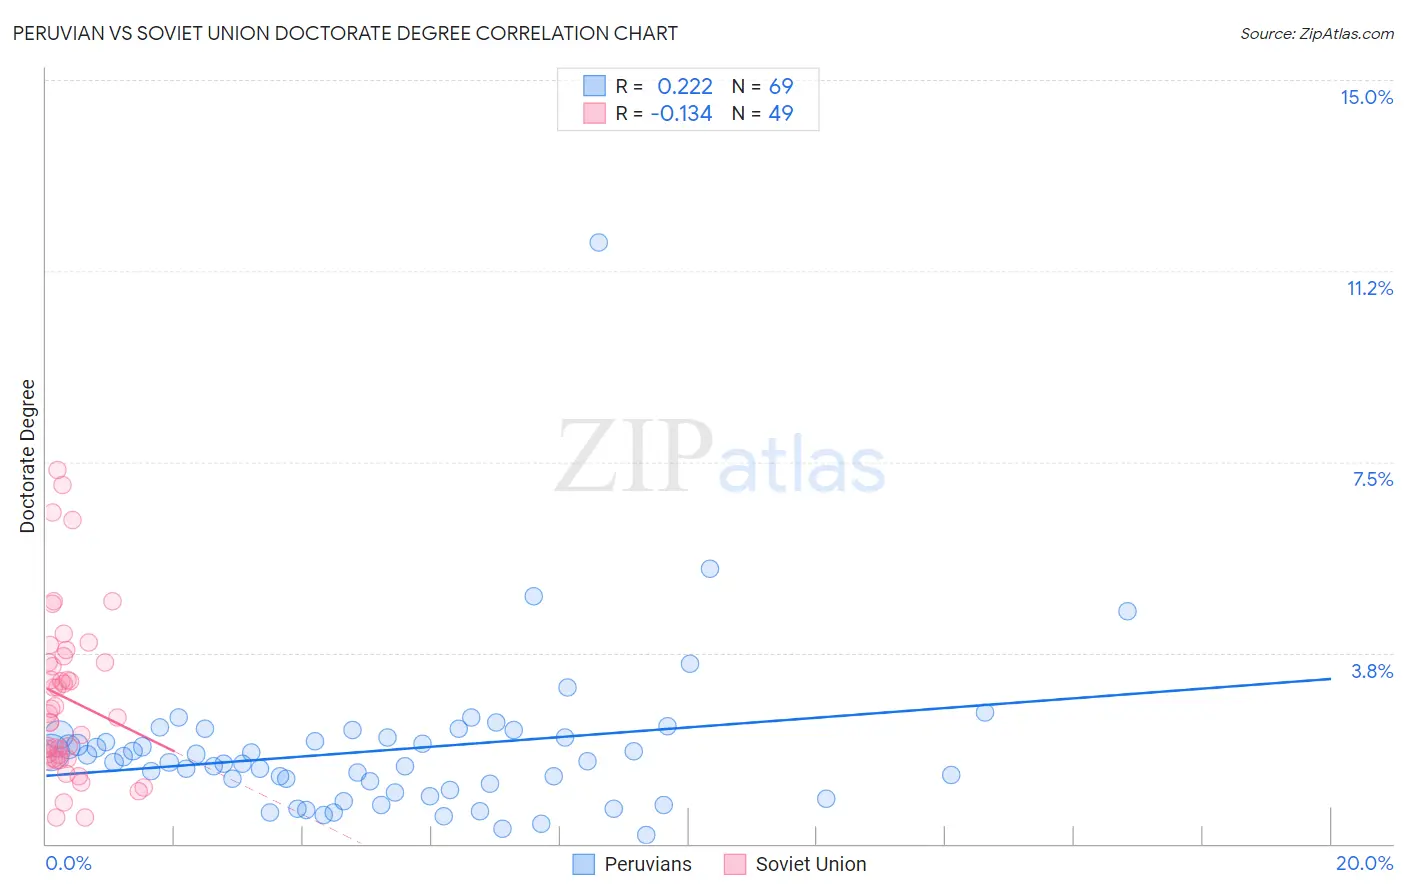
Peruvian vs Soviet Union Doctorate Degree Correlation Chart
The statistical analysis conducted on geographies consisting of 360,973,497 people shows a weak positive correlation between the proportion of Peruvians and percentage of population with at least doctorate degree education in the United States with a correlation coefficient (R) of 0.222 and weighted average of 1.8%. Similarly, the statistical analysis conducted on geographies consisting of 43,500,474 people shows a poor negative correlation between the proportion of Soviet Union and percentage of population with at least doctorate degree education in the United States with a correlation coefficient (R) of -0.134 and weighted average of 2.5%, a difference of 38.2%.
Doctorate Degree Correlation Summary
| Measurement | Peruvian | Soviet Union |
| Minimum | 0.17% | 0.52% |
| Maximum | 11.8% | 7.3% |
| Range | 11.6% | 6.8% |
| Mean | 1.8% | 2.9% |
| Median | 1.6% | 2.5% |
| Interquartile 25% (IQ1) | 1.0% | 1.7% |
| Interquartile 75% (IQ3) | 2.1% | 3.6% |
| Interquartile Range (IQR) | 1.1% | 2.0% |
| Standard Deviation (Sample) | 1.6% | 1.6% |
| Standard Deviation (Population) | 1.5% | 1.6% |
Similar Demographics by Doctorate Degree
Demographics Similar to Peruvians by Doctorate Degree
In terms of doctorate degree, the demographic groups most similar to Peruvians are Czechoslovakian (1.8%, a difference of 0.23%), Slovak (1.8%, a difference of 0.32%), German (1.8%, a difference of 0.68%), French Canadian (1.8%, a difference of 0.72%), and Immigrants from Costa Rica (1.8%, a difference of 0.73%).
| Demographics | Rating | Rank | Doctorate Degree |
| Ghanaians | 48.3 /100 | #179 | Average 1.8% |
| Scandinavians | 48.0 /100 | #180 | Average 1.8% |
| Immigrants | Immigrants | 46.2 /100 | #181 | Average 1.8% |
| Immigrants | Afghanistan | 44.3 /100 | #182 | Average 1.8% |
| Finns | 42.1 /100 | #183 | Average 1.8% |
| Nigerians | 39.9 /100 | #184 | Fair 1.8% |
| Slovaks | 36.4 /100 | #185 | Fair 1.8% |
| Peruvians | 34.4 /100 | #186 | Fair 1.8% |
| Czechoslovakians | 33.0 /100 | #187 | Fair 1.8% |
| Germans | 30.5 /100 | #188 | Fair 1.8% |
| French Canadians | 30.2 /100 | #189 | Fair 1.8% |
| Immigrants | Costa Rica | 30.2 /100 | #190 | Fair 1.8% |
| South Americans | 29.5 /100 | #191 | Fair 1.8% |
| Dutch | 27.4 /100 | #192 | Fair 1.8% |
| German Russians | 27.1 /100 | #193 | Fair 1.8% |
Demographics Similar to Soviet Union by Doctorate Degree
In terms of doctorate degree, the demographic groups most similar to Soviet Union are Immigrants from Netherlands (2.5%, a difference of 0.040%), New Zealander (2.5%, a difference of 0.94%), Immigrants from South Africa (2.4%, a difference of 1.5%), Immigrants from Russia (2.5%, a difference of 1.6%), and Immigrants from Austria (2.4%, a difference of 1.7%).
| Demographics | Rating | Rank | Doctorate Degree |
| Immigrants | Spain | 100.0 /100 | #36 | Exceptional 2.6% |
| Immigrants | Kuwait | 100.0 /100 | #37 | Exceptional 2.6% |
| Russians | 100.0 /100 | #38 | Exceptional 2.6% |
| Immigrants | Ireland | 100.0 /100 | #39 | Exceptional 2.5% |
| Estonians | 100.0 /100 | #40 | Exceptional 2.5% |
| Immigrants | Russia | 100.0 /100 | #41 | Exceptional 2.5% |
| New Zealanders | 100.0 /100 | #42 | Exceptional 2.5% |
| Soviet Union | 100.0 /100 | #43 | Exceptional 2.5% |
| Immigrants | Netherlands | 100.0 /100 | #44 | Exceptional 2.5% |
| Immigrants | South Africa | 100.0 /100 | #45 | Exceptional 2.4% |
| Immigrants | Austria | 100.0 /100 | #46 | Exceptional 2.4% |
| Immigrants | Western Europe | 100.0 /100 | #47 | Exceptional 2.4% |
| Asians | 100.0 /100 | #48 | Exceptional 2.4% |
| Immigrants | Asia | 100.0 /100 | #49 | Exceptional 2.4% |
| Immigrants | Norway | 100.0 /100 | #50 | Exceptional 2.4% |