Immigrants from Haiti vs Japanese Doctorate Degree
COMPARE
Immigrants from Haiti
Japanese
Doctorate Degree
Doctorate Degree Comparison
Immigrants from Haiti
Japanese
1.3%
DOCTORATE DEGREE
0.0/ 100
METRIC RATING
335th/ 347
METRIC RANK
1.5%
DOCTORATE DEGREE
0.9/ 100
METRIC RATING
260th/ 347
METRIC RANK
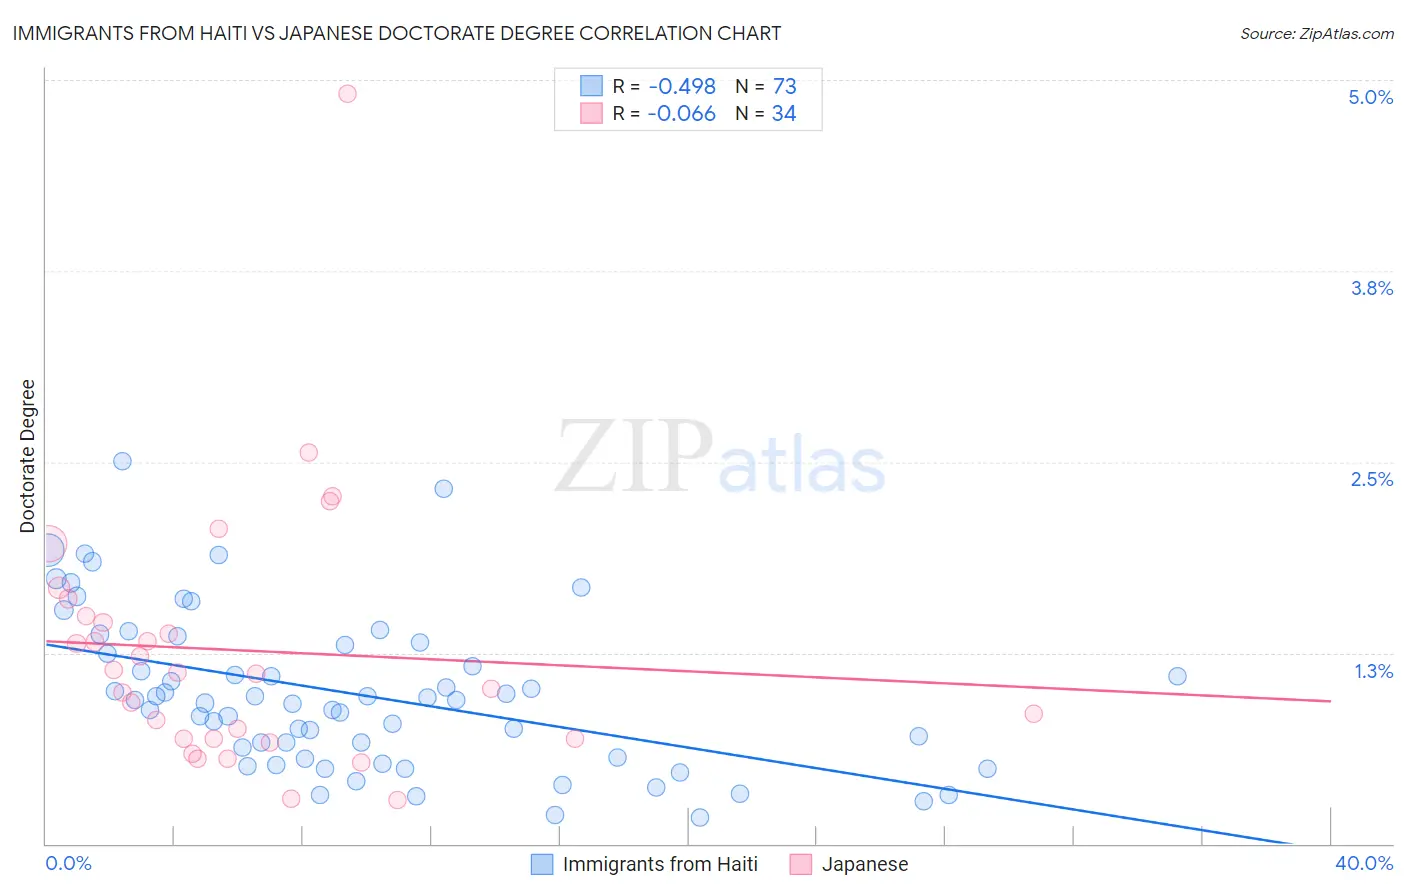
Immigrants from Haiti vs Japanese Doctorate Degree Correlation Chart
The statistical analysis conducted on geographies consisting of 224,109,380 people shows a moderate negative correlation between the proportion of Immigrants from Haiti and percentage of population with at least doctorate degree education in the United States with a correlation coefficient (R) of -0.498 and weighted average of 1.3%. Similarly, the statistical analysis conducted on geographies consisting of 247,895,827 people shows a slight negative correlation between the proportion of Japanese and percentage of population with at least doctorate degree education in the United States with a correlation coefficient (R) of -0.066 and weighted average of 1.5%, a difference of 20.9%.
Doctorate Degree Correlation Summary
| Measurement | Immigrants from Haiti | Japanese |
| Minimum | 0.17% | 0.29% |
| Maximum | 2.5% | 4.9% |
| Range | 2.3% | 4.6% |
| Mean | 0.98% | 1.3% |
| Median | 0.94% | 1.1% |
| Interquartile 25% (IQ1) | 0.56% | 0.69% |
| Interquartile 75% (IQ3) | 1.3% | 1.5% |
| Interquartile Range (IQR) | 0.75% | 0.80% |
| Standard Deviation (Sample) | 0.51% | 0.87% |
| Standard Deviation (Population) | 0.51% | 0.85% |
Similar Demographics by Doctorate Degree
Demographics Similar to Immigrants from Haiti by Doctorate Degree
In terms of doctorate degree, the demographic groups most similar to Immigrants from Haiti are Nepalese (1.3%, a difference of 0.23%), Immigrants from Dominican Republic (1.3%, a difference of 1.8%), Immigrants from Caribbean (1.3%, a difference of 2.0%), Yakama (1.3%, a difference of 2.1%), and Bangladeshi (1.2%, a difference of 3.7%).
| Demographics | Rating | Rank | Doctorate Degree |
| Inupiat | 0.0 /100 | #328 | Tragic 1.3% |
| Haitians | 0.0 /100 | #329 | Tragic 1.3% |
| Yup'ik | 0.0 /100 | #330 | Tragic 1.3% |
| Immigrants | Latin America | 0.0 /100 | #331 | Tragic 1.3% |
| Yakama | 0.0 /100 | #332 | Tragic 1.3% |
| Immigrants | Caribbean | 0.0 /100 | #333 | Tragic 1.3% |
| Immigrants | Dominican Republic | 0.0 /100 | #334 | Tragic 1.3% |
| Immigrants | Haiti | 0.0 /100 | #335 | Tragic 1.3% |
| Nepalese | 0.0 /100 | #336 | Tragic 1.3% |
| Bangladeshis | 0.0 /100 | #337 | Tragic 1.2% |
| Puget Sound Salish | 0.0 /100 | #338 | Tragic 1.2% |
| Immigrants | Central America | 0.0 /100 | #339 | Tragic 1.2% |
| Immigrants | Cuba | 0.0 /100 | #340 | Tragic 1.2% |
| Mexicans | 0.0 /100 | #341 | Tragic 1.2% |
| Arapaho | 0.0 /100 | #342 | Tragic 1.2% |
Demographics Similar to Japanese by Doctorate Degree
In terms of doctorate degree, the demographic groups most similar to Japanese are Liberian (1.5%, a difference of 0.10%), Immigrants from West Indies (1.5%, a difference of 0.12%), Chippewa (1.5%, a difference of 0.38%), Immigrants from Portugal (1.5%, a difference of 0.46%), and Central American Indian (1.5%, a difference of 0.60%).
| Demographics | Rating | Rank | Doctorate Degree |
| Americans | 1.0 /100 | #253 | Tragic 1.5% |
| Immigrants | Cambodia | 1.0 /100 | #254 | Tragic 1.5% |
| Trinidadians and Tobagonians | 1.0 /100 | #255 | Tragic 1.5% |
| Central American Indians | 1.0 /100 | #256 | Tragic 1.5% |
| Chippewa | 0.9 /100 | #257 | Tragic 1.5% |
| Immigrants | West Indies | 0.9 /100 | #258 | Tragic 1.5% |
| Liberians | 0.9 /100 | #259 | Tragic 1.5% |
| Japanese | 0.9 /100 | #260 | Tragic 1.5% |
| Immigrants | Portugal | 0.8 /100 | #261 | Tragic 1.5% |
| Chickasaw | 0.7 /100 | #262 | Tragic 1.5% |
| Immigrants | Bahamas | 0.7 /100 | #263 | Tragic 1.5% |
| Blackfeet | 0.7 /100 | #264 | Tragic 1.5% |
| Nicaraguans | 0.6 /100 | #265 | Tragic 1.5% |
| Immigrants | Liberia | 0.5 /100 | #266 | Tragic 1.5% |
| Kiowa | 0.5 /100 | #267 | Tragic 1.5% |