Polish vs Soviet Union Doctorate Degree
COMPARE
Polish
Soviet Union
Doctorate Degree
Doctorate Degree Comparison
Poles
Soviet Union
1.9%
DOCTORATE DEGREE
72.7/ 100
METRIC RATING
155th/ 347
METRIC RANK
2.5%
DOCTORATE DEGREE
100.0/ 100
METRIC RATING
43rd/ 347
METRIC RANK
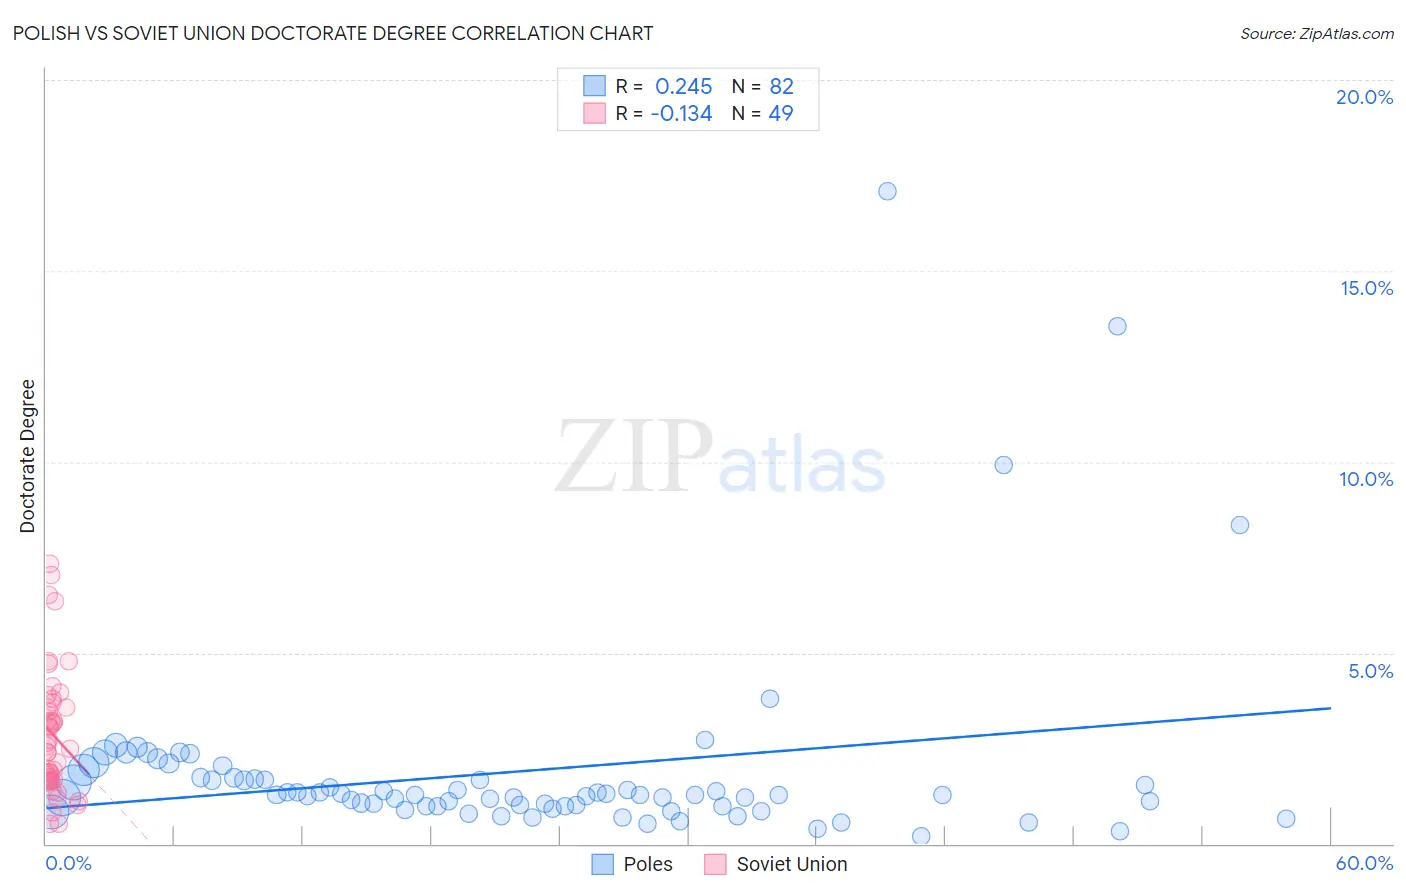
Polish vs Soviet Union Doctorate Degree Correlation Chart
The statistical analysis conducted on geographies consisting of 539,143,774 people shows a weak positive correlation between the proportion of Poles and percentage of population with at least doctorate degree education in the United States with a correlation coefficient (R) of 0.245 and weighted average of 1.9%. Similarly, the statistical analysis conducted on geographies consisting of 43,500,474 people shows a poor negative correlation between the proportion of Soviet Union and percentage of population with at least doctorate degree education in the United States with a correlation coefficient (R) of -0.134 and weighted average of 2.5%, a difference of 30.3%.
Doctorate Degree Correlation Summary
| Measurement | Polish | Soviet Union |
| Minimum | 0.20% | 0.52% |
| Maximum | 17.1% | 7.3% |
| Range | 16.9% | 6.8% |
| Mean | 1.9% | 2.9% |
| Median | 1.3% | 2.5% |
| Interquartile 25% (IQ1) | 0.98% | 1.7% |
| Interquartile 75% (IQ3) | 1.7% | 3.6% |
| Interquartile Range (IQR) | 0.71% | 2.0% |
| Standard Deviation (Sample) | 2.5% | 1.6% |
| Standard Deviation (Population) | 2.5% | 1.6% |
Similar Demographics by Doctorate Degree
Demographics Similar to Poles by Doctorate Degree
In terms of doctorate degree, the demographic groups most similar to Poles are Immigrants from Albania (1.9%, a difference of 0.020%), Slavic (1.9%, a difference of 0.060%), Danish (1.9%, a difference of 0.14%), Hungarian (1.9%, a difference of 0.17%), and Immigrants from Oceania (1.9%, a difference of 0.24%).
| Demographics | Rating | Rank | Doctorate Degree |
| Luxembourgers | 81.1 /100 | #148 | Excellent 1.9% |
| Basques | 76.9 /100 | #149 | Good 1.9% |
| English | 75.9 /100 | #150 | Good 1.9% |
| Albanians | 74.8 /100 | #151 | Good 1.9% |
| Immigrants | Kenya | 74.3 /100 | #152 | Good 1.9% |
| Immigrants | Oceania | 74.0 /100 | #153 | Good 1.9% |
| Immigrants | Albania | 72.8 /100 | #154 | Good 1.9% |
| Poles | 72.7 /100 | #155 | Good 1.9% |
| Slavs | 72.4 /100 | #156 | Good 1.9% |
| Danes | 71.9 /100 | #157 | Good 1.9% |
| Hungarians | 71.7 /100 | #158 | Good 1.9% |
| Slovenes | 70.2 /100 | #159 | Good 1.9% |
| Welsh | 69.7 /100 | #160 | Good 1.9% |
| Immigrants | Middle Africa | 68.8 /100 | #161 | Good 1.9% |
| Irish | 67.5 /100 | #162 | Good 1.9% |
Demographics Similar to Soviet Union by Doctorate Degree
In terms of doctorate degree, the demographic groups most similar to Soviet Union are Immigrants from Netherlands (2.5%, a difference of 0.040%), New Zealander (2.5%, a difference of 0.94%), Immigrants from South Africa (2.4%, a difference of 1.5%), Immigrants from Russia (2.5%, a difference of 1.6%), and Immigrants from Austria (2.4%, a difference of 1.7%).
| Demographics | Rating | Rank | Doctorate Degree |
| Immigrants | Spain | 100.0 /100 | #36 | Exceptional 2.6% |
| Immigrants | Kuwait | 100.0 /100 | #37 | Exceptional 2.6% |
| Russians | 100.0 /100 | #38 | Exceptional 2.6% |
| Immigrants | Ireland | 100.0 /100 | #39 | Exceptional 2.5% |
| Estonians | 100.0 /100 | #40 | Exceptional 2.5% |
| Immigrants | Russia | 100.0 /100 | #41 | Exceptional 2.5% |
| New Zealanders | 100.0 /100 | #42 | Exceptional 2.5% |
| Soviet Union | 100.0 /100 | #43 | Exceptional 2.5% |
| Immigrants | Netherlands | 100.0 /100 | #44 | Exceptional 2.5% |
| Immigrants | South Africa | 100.0 /100 | #45 | Exceptional 2.4% |
| Immigrants | Austria | 100.0 /100 | #46 | Exceptional 2.4% |
| Immigrants | Western Europe | 100.0 /100 | #47 | Exceptional 2.4% |
| Asians | 100.0 /100 | #48 | Exceptional 2.4% |
| Immigrants | Asia | 100.0 /100 | #49 | Exceptional 2.4% |
| Immigrants | Norway | 100.0 /100 | #50 | Exceptional 2.4% |