Immigrants from Croatia vs Mexican College, Under 1 year
COMPARE
Immigrants from Croatia
Mexican
College, Under 1 year
College, Under 1 year Comparison
Immigrants from Croatia
Mexicans
67.8%
COLLEGE, UNDER 1 YEAR
96.6/ 100
METRIC RATING
106th/ 347
METRIC RANK
55.6%
COLLEGE, UNDER 1 YEAR
0.0/ 100
METRIC RATING
330th/ 347
METRIC RANK
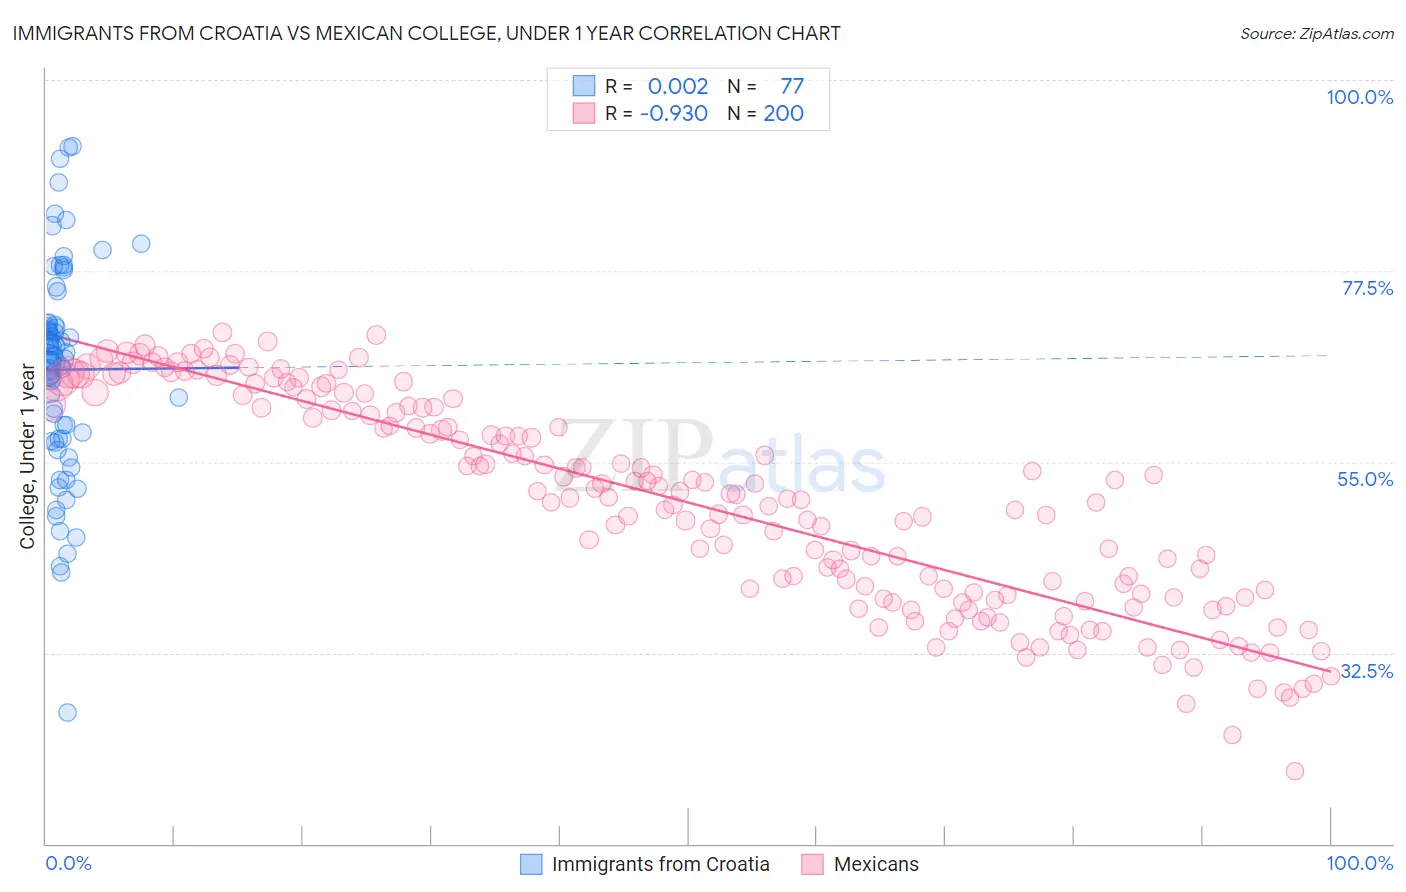
Immigrants from Croatia vs Mexican College, Under 1 year Correlation Chart
The statistical analysis conducted on geographies consisting of 132,577,989 people shows no correlation between the proportion of Immigrants from Croatia and percentage of population with at least college, under 1 year education in the United States with a correlation coefficient (R) of 0.002 and weighted average of 67.8%. Similarly, the statistical analysis conducted on geographies consisting of 565,321,978 people shows a near-perfect negative correlation between the proportion of Mexicans and percentage of population with at least college, under 1 year education in the United States with a correlation coefficient (R) of -0.930 and weighted average of 55.6%, a difference of 21.9%.
College, Under 1 year Correlation Summary
| Measurement | Immigrants from Croatia | Mexican |
| Minimum | 25.4% | 18.5% |
| Maximum | 92.2% | 70.3% |
| Range | 66.8% | 51.8% |
| Mean | 65.9% | 50.2% |
| Median | 67.1% | 51.0% |
| Interquartile 25% (IQ1) | 57.8% | 39.2% |
| Interquartile 75% (IQ3) | 71.3% | 61.5% |
| Interquartile Range (IQR) | 13.5% | 22.3% |
| Standard Deviation (Sample) | 12.3% | 12.4% |
| Standard Deviation (Population) | 12.3% | 12.4% |
Similar Demographics by College, Under 1 year
Demographics Similar to Immigrants from Croatia by College, Under 1 year
In terms of college, under 1 year, the demographic groups most similar to Immigrants from Croatia are Immigrants from Western Asia (67.8%, a difference of 0.010%), Afghan (67.8%, a difference of 0.010%), Austrian (67.8%, a difference of 0.060%), Palestinian (67.9%, a difference of 0.090%), and Carpatho Rusyn (67.9%, a difference of 0.090%).
| Demographics | Rating | Rank | College, Under 1 year |
| Immigrants | Bolivia | 97.0 /100 | #99 | Exceptional 67.9% |
| Immigrants | Argentina | 97.0 /100 | #100 | Exceptional 67.9% |
| Immigrants | Eastern Europe | 96.9 /100 | #101 | Exceptional 67.9% |
| Palestinians | 96.9 /100 | #102 | Exceptional 67.9% |
| Carpatho Rusyns | 96.8 /100 | #103 | Exceptional 67.9% |
| Immigrants | Western Asia | 96.6 /100 | #104 | Exceptional 67.8% |
| Afghans | 96.6 /100 | #105 | Exceptional 67.8% |
| Immigrants | Croatia | 96.6 /100 | #106 | Exceptional 67.8% |
| Austrians | 96.4 /100 | #107 | Exceptional 67.8% |
| Immigrants | Egypt | 96.0 /100 | #108 | Exceptional 67.7% |
| Scandinavians | 95.8 /100 | #109 | Exceptional 67.7% |
| Assyrians/Chaldeans/Syriacs | 95.8 /100 | #110 | Exceptional 67.7% |
| Ukrainians | 95.8 /100 | #111 | Exceptional 67.7% |
| Macedonians | 95.7 /100 | #112 | Exceptional 67.6% |
| Syrians | 95.6 /100 | #113 | Exceptional 67.6% |
Demographics Similar to Mexicans by College, Under 1 year
In terms of college, under 1 year, the demographic groups most similar to Mexicans are Immigrants from Cuba (55.7%, a difference of 0.13%), Dominican (55.5%, a difference of 0.26%), Immigrants from Yemen (55.3%, a difference of 0.67%), Cape Verdean (56.0%, a difference of 0.75%), and Yuman (55.1%, a difference of 0.99%).
| Demographics | Rating | Rank | College, Under 1 year |
| Immigrants | Honduras | 0.0 /100 | #323 | Tragic 56.5% |
| Immigrants | El Salvador | 0.0 /100 | #324 | Tragic 56.4% |
| Immigrants | Latin America | 0.0 /100 | #325 | Tragic 56.3% |
| Navajo | 0.0 /100 | #326 | Tragic 56.3% |
| Immigrants | Guatemala | 0.0 /100 | #327 | Tragic 56.2% |
| Cape Verdeans | 0.0 /100 | #328 | Tragic 56.0% |
| Immigrants | Cuba | 0.0 /100 | #329 | Tragic 55.7% |
| Mexicans | 0.0 /100 | #330 | Tragic 55.6% |
| Dominicans | 0.0 /100 | #331 | Tragic 55.5% |
| Immigrants | Yemen | 0.0 /100 | #332 | Tragic 55.3% |
| Yuman | 0.0 /100 | #333 | Tragic 55.1% |
| Immigrants | Azores | 0.0 /100 | #334 | Tragic 54.7% |
| Inupiat | 0.0 /100 | #335 | Tragic 54.6% |
| Pennsylvania Germans | 0.0 /100 | #336 | Tragic 54.5% |
| Immigrants | Central America | 0.0 /100 | #337 | Tragic 54.4% |