Immigrants from Grenada vs Mexican Professional Degree
COMPARE
Immigrants from Grenada
Mexican
Professional Degree
Professional Degree Comparison
Immigrants from Grenada
Mexicans
3.7%
PROFESSIONAL DEGREE
1.5/ 100
METRIC RATING
249th/ 347
METRIC RANK
2.7%
PROFESSIONAL DEGREE
0.0/ 100
METRIC RATING
343rd/ 347
METRIC RANK
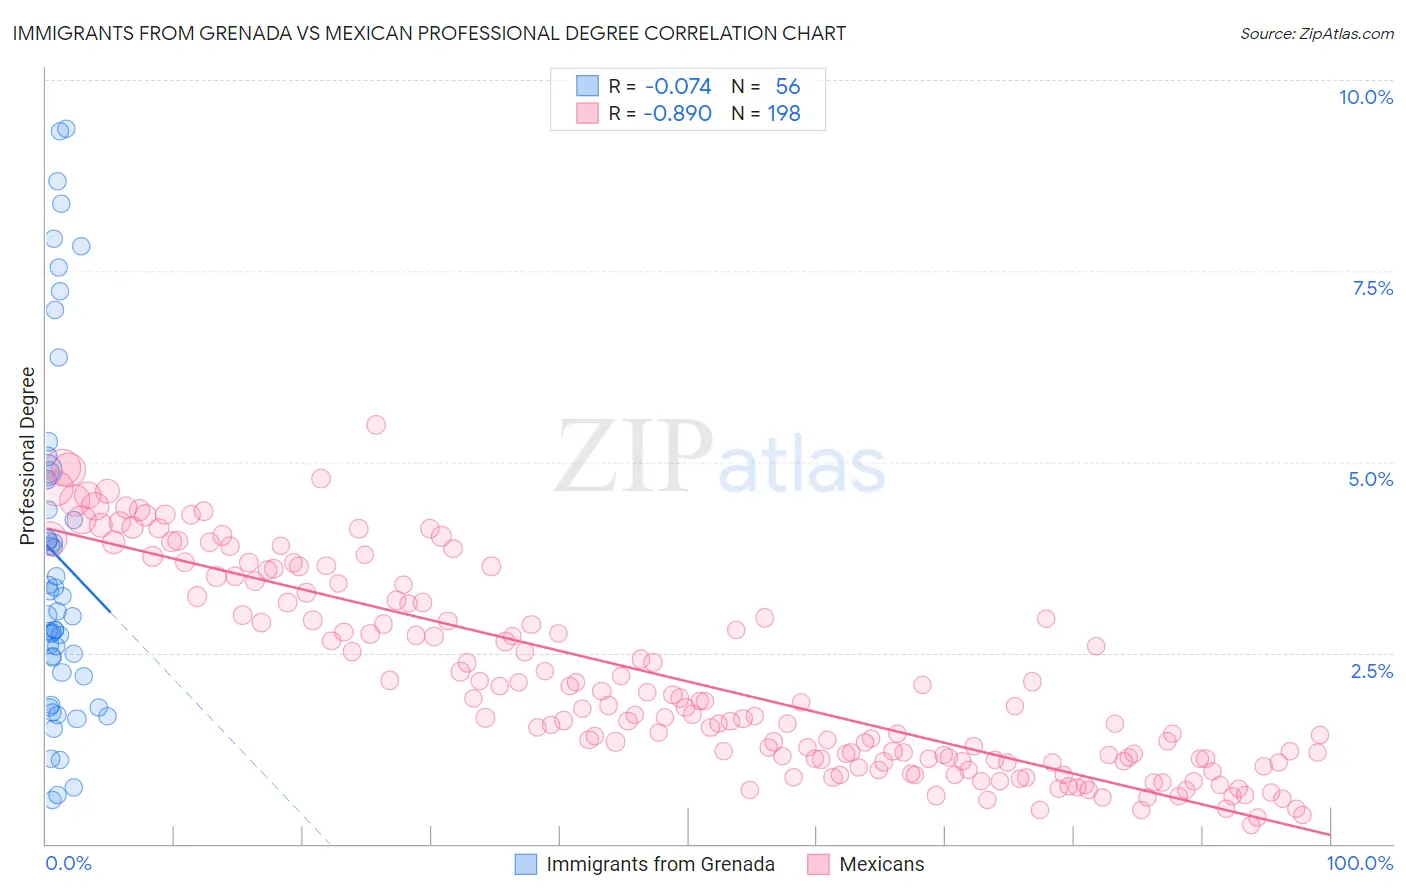
Immigrants from Grenada vs Mexican Professional Degree Correlation Chart
The statistical analysis conducted on geographies consisting of 67,193,029 people shows a slight negative correlation between the proportion of Immigrants from Grenada and percentage of population with at least professional degree education in the United States with a correlation coefficient (R) of -0.074 and weighted average of 3.7%. Similarly, the statistical analysis conducted on geographies consisting of 557,026,409 people shows a very strong negative correlation between the proportion of Mexicans and percentage of population with at least professional degree education in the United States with a correlation coefficient (R) of -0.890 and weighted average of 2.7%, a difference of 36.1%.
Professional Degree Correlation Summary
| Measurement | Immigrants from Grenada | Mexican |
| Minimum | 0.57% | 0.25% |
| Maximum | 9.4% | 5.5% |
| Range | 8.8% | 5.2% |
| Mean | 3.7% | 2.1% |
| Median | 3.0% | 1.7% |
| Interquartile 25% (IQ1) | 2.2% | 1.1% |
| Interquartile 75% (IQ3) | 4.8% | 3.2% |
| Interquartile Range (IQR) | 2.6% | 2.1% |
| Standard Deviation (Sample) | 2.3% | 1.3% |
| Standard Deviation (Population) | 2.3% | 1.3% |
Similar Demographics by Professional Degree
Demographics Similar to Immigrants from Grenada by Professional Degree
In terms of professional degree, the demographic groups most similar to Immigrants from Grenada are Immigrants from Fiji (3.7%, a difference of 0.060%), Hmong (3.7%, a difference of 0.11%), Guyanese (3.8%, a difference of 0.27%), Marshallese (3.8%, a difference of 0.30%), and Immigrants from Nicaragua (3.7%, a difference of 0.31%).
| Demographics | Rating | Rank | Professional Degree |
| Native Hawaiians | 2.3 /100 | #242 | Tragic 3.8% |
| Guamanians/Chamorros | 2.2 /100 | #243 | Tragic 3.8% |
| Immigrants | Bahamas | 2.0 /100 | #244 | Tragic 3.8% |
| French American Indians | 1.7 /100 | #245 | Tragic 3.8% |
| Marshallese | 1.7 /100 | #246 | Tragic 3.8% |
| Guyanese | 1.6 /100 | #247 | Tragic 3.8% |
| Hmong | 1.6 /100 | #248 | Tragic 3.7% |
| Immigrants | Grenada | 1.5 /100 | #249 | Tragic 3.7% |
| Immigrants | Fiji | 1.5 /100 | #250 | Tragic 3.7% |
| Immigrants | Nicaragua | 1.4 /100 | #251 | Tragic 3.7% |
| Jamaicans | 1.4 /100 | #252 | Tragic 3.7% |
| Pueblo | 1.4 /100 | #253 | Tragic 3.7% |
| Tongans | 1.3 /100 | #254 | Tragic 3.7% |
| Osage | 1.2 /100 | #255 | Tragic 3.7% |
| Iroquois | 1.2 /100 | #256 | Tragic 3.7% |
Demographics Similar to Mexicans by Professional Degree
In terms of professional degree, the demographic groups most similar to Mexicans are Immigrants from the Azores (2.8%, a difference of 2.8%), Tohono O'odham (2.8%, a difference of 3.5%), Spanish American Indian (2.7%, a difference of 3.6%), Immigrants from Mexico (2.6%, a difference of 4.0%), and Yup'ik (2.9%, a difference of 4.3%).
| Demographics | Rating | Rank | Professional Degree |
| Puget Sound Salish | 0.0 /100 | #333 | Tragic 3.1% |
| Pennsylvania Germans | 0.0 /100 | #334 | Tragic 3.0% |
| Natives/Alaskans | 0.0 /100 | #335 | Tragic 3.0% |
| Fijians | 0.0 /100 | #336 | Tragic 2.9% |
| Arapaho | 0.0 /100 | #337 | Tragic 2.9% |
| Navajo | 0.0 /100 | #338 | Tragic 2.9% |
| Immigrants | Central America | 0.0 /100 | #339 | Tragic 2.9% |
| Yup'ik | 0.0 /100 | #340 | Tragic 2.9% |
| Tohono O'odham | 0.0 /100 | #341 | Tragic 2.8% |
| Immigrants | Azores | 0.0 /100 | #342 | Tragic 2.8% |
| Mexicans | 0.0 /100 | #343 | Tragic 2.7% |
| Spanish American Indians | 0.0 /100 | #344 | Tragic 2.7% |
| Immigrants | Mexico | 0.0 /100 | #345 | Tragic 2.6% |
| Lumbee | 0.0 /100 | #346 | Tragic 2.5% |
| Houma | 0.0 /100 | #347 | Tragic 2.2% |