Immigrants from St. Vincent and the Grenadines vs Guatemalan GED/Equivalency
COMPARE
Immigrants from St. Vincent and the Grenadines
Guatemalan
GED/Equivalency
GED/Equivalency Comparison
Immigrants from St. Vincent and the Grenadines
Guatemalans
82.0%
GED/EQUIVALENCY
0.0/ 100
METRIC RATING
294th/ 347
METRIC RANK
78.5%
GED/EQUIVALENCY
0.0/ 100
METRIC RATING
334th/ 347
METRIC RANK
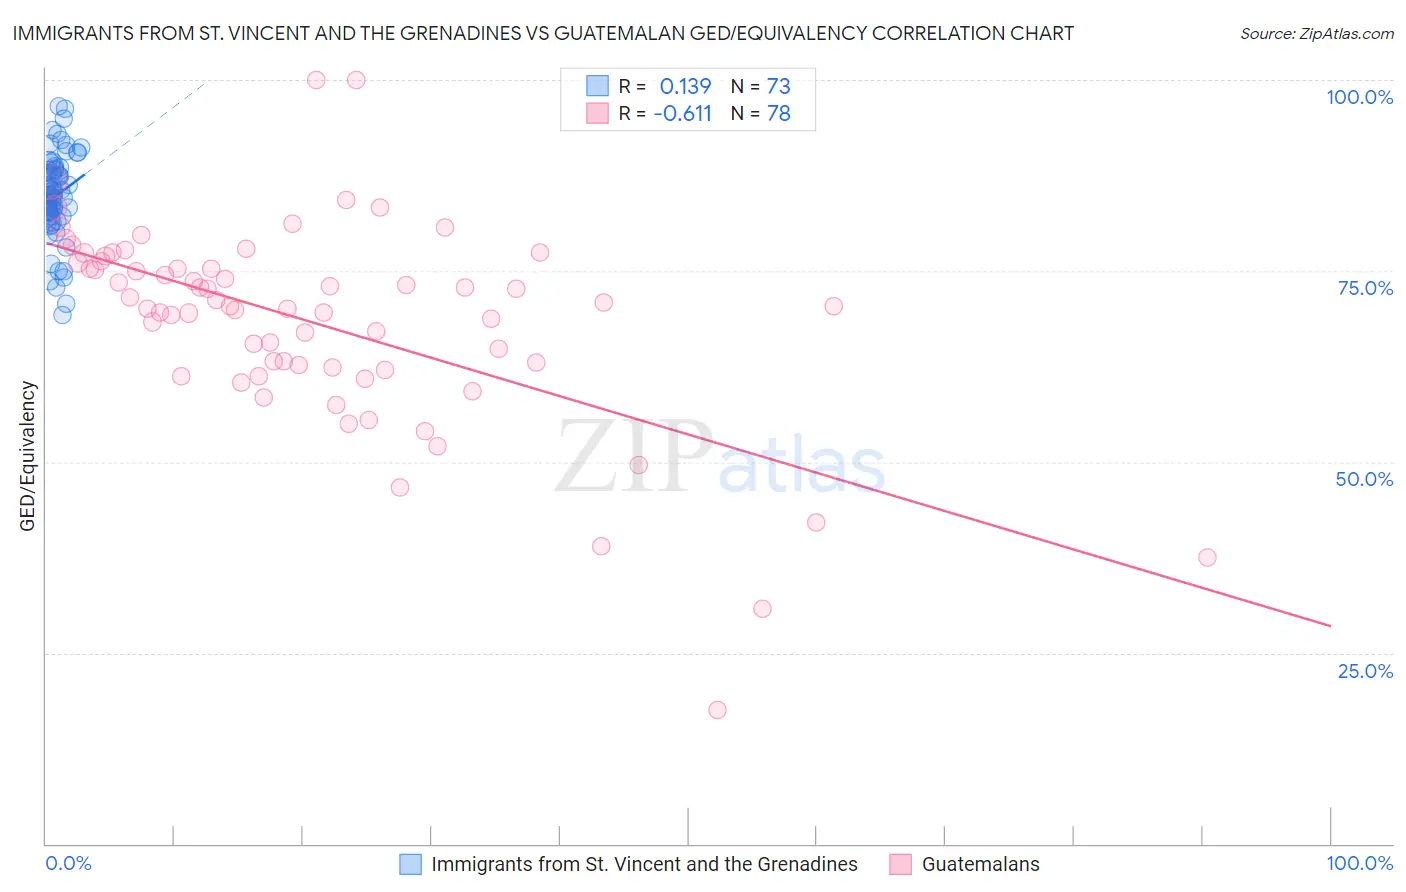
Immigrants from St. Vincent and the Grenadines vs Guatemalan GED/Equivalency Correlation Chart
The statistical analysis conducted on geographies consisting of 56,191,418 people shows a poor positive correlation between the proportion of Immigrants from St. Vincent and the Grenadines and percentage of population with at least ged/equivalency education in the United States with a correlation coefficient (R) of 0.139 and weighted average of 82.0%. Similarly, the statistical analysis conducted on geographies consisting of 409,566,541 people shows a significant negative correlation between the proportion of Guatemalans and percentage of population with at least ged/equivalency education in the United States with a correlation coefficient (R) of -0.611 and weighted average of 78.5%, a difference of 4.4%.
GED/Equivalency Correlation Summary
| Measurement | Immigrants from St. Vincent and the Grenadines | Guatemalan |
| Minimum | 69.2% | 17.6% |
| Maximum | 96.6% | 100.0% |
| Range | 27.3% | 82.4% |
| Mean | 84.8% | 68.3% |
| Median | 85.0% | 70.4% |
| Interquartile 25% (IQ1) | 82.1% | 62.3% |
| Interquartile 75% (IQ3) | 88.3% | 76.0% |
| Interquartile Range (IQR) | 6.2% | 13.7% |
| Standard Deviation (Sample) | 5.6% | 13.4% |
| Standard Deviation (Population) | 5.6% | 13.3% |
Similar Demographics by GED/Equivalency
Demographics Similar to Immigrants from St. Vincent and the Grenadines by GED/Equivalency
In terms of ged/equivalency, the demographic groups most similar to Immigrants from St. Vincent and the Grenadines are Paiute (82.0%, a difference of 0.030%), British West Indian (82.0%, a difference of 0.030%), Nepalese (81.9%, a difference of 0.060%), Cuban (82.0%, a difference of 0.070%), and Haitian (82.1%, a difference of 0.090%).
| Demographics | Rating | Rank | GED/Equivalency |
| Japanese | 0.0 /100 | #287 | Tragic 82.4% |
| Pueblo | 0.0 /100 | #288 | Tragic 82.3% |
| Immigrants | Cambodia | 0.0 /100 | #289 | Tragic 82.2% |
| Haitians | 0.0 /100 | #290 | Tragic 82.1% |
| Cubans | 0.0 /100 | #291 | Tragic 82.0% |
| Paiute | 0.0 /100 | #292 | Tragic 82.0% |
| British West Indians | 0.0 /100 | #293 | Tragic 82.0% |
| Immigrants | St. Vincent and the Grenadines | 0.0 /100 | #294 | Tragic 82.0% |
| Nepalese | 0.0 /100 | #295 | Tragic 81.9% |
| Vietnamese | 0.0 /100 | #296 | Tragic 81.9% |
| Immigrants | Bangladesh | 0.0 /100 | #297 | Tragic 81.9% |
| Ute | 0.0 /100 | #298 | Tragic 81.8% |
| Ecuadorians | 0.0 /100 | #299 | Tragic 81.7% |
| Fijians | 0.0 /100 | #300 | Tragic 81.6% |
| Dutch West Indians | 0.0 /100 | #301 | Tragic 81.6% |
Demographics Similar to Guatemalans by GED/Equivalency
In terms of ged/equivalency, the demographic groups most similar to Guatemalans are Immigrants from Latin America (78.5%, a difference of 0.020%), Salvadoran (78.6%, a difference of 0.080%), Immigrants from the Azores (78.7%, a difference of 0.20%), Immigrants from Honduras (78.7%, a difference of 0.31%), and Immigrants from Cabo Verde (78.9%, a difference of 0.55%).
| Demographics | Rating | Rank | GED/Equivalency |
| Central Americans | 0.0 /100 | #327 | Tragic 79.2% |
| Hispanics or Latinos | 0.0 /100 | #328 | Tragic 79.1% |
| Dominicans | 0.0 /100 | #329 | Tragic 79.1% |
| Immigrants | Cabo Verde | 0.0 /100 | #330 | Tragic 78.9% |
| Immigrants | Honduras | 0.0 /100 | #331 | Tragic 78.7% |
| Immigrants | Azores | 0.0 /100 | #332 | Tragic 78.7% |
| Salvadorans | 0.0 /100 | #333 | Tragic 78.6% |
| Guatemalans | 0.0 /100 | #334 | Tragic 78.5% |
| Immigrants | Latin America | 0.0 /100 | #335 | Tragic 78.5% |
| Immigrants | Dominican Republic | 0.0 /100 | #336 | Tragic 78.0% |
| Immigrants | Yemen | 0.0 /100 | #337 | Tragic 77.9% |
| Immigrants | Guatemala | 0.0 /100 | #338 | Tragic 77.9% |
| Immigrants | El Salvador | 0.0 /100 | #339 | Tragic 77.6% |
| Tohono O'odham | 0.0 /100 | #340 | Tragic 77.5% |
| Mexicans | 0.0 /100 | #341 | Tragic 77.4% |