Native Hawaiian vs Guatemalan GED/Equivalency
COMPARE
Native Hawaiian
Guatemalan
GED/Equivalency
GED/Equivalency Comparison
Native Hawaiians
Guatemalans
87.5%
GED/EQUIVALENCY
98.1/ 100
METRIC RATING
87th/ 347
METRIC RANK
78.5%
GED/EQUIVALENCY
0.0/ 100
METRIC RATING
334th/ 347
METRIC RANK
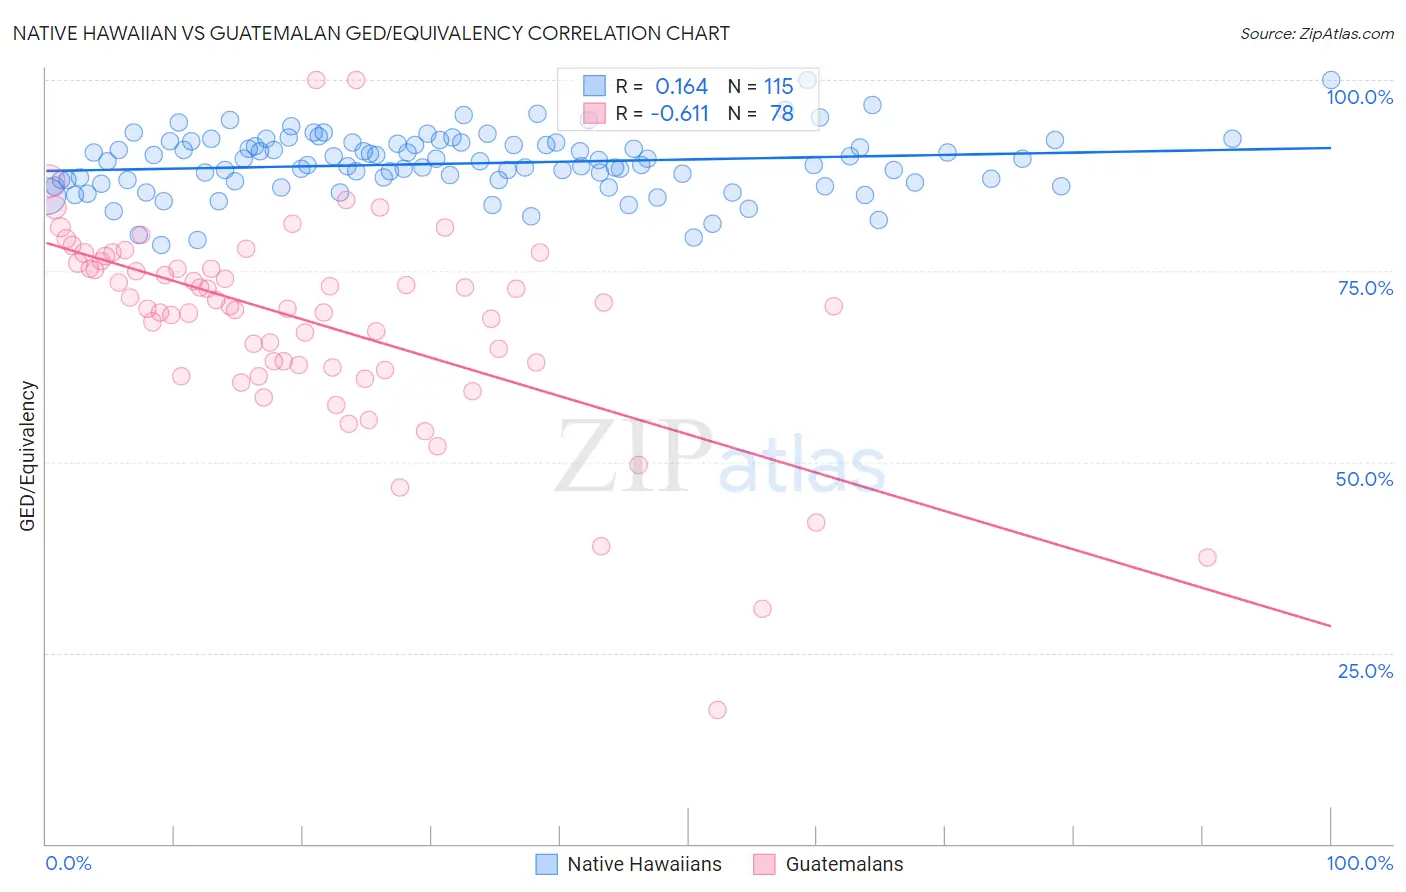
Native Hawaiian vs Guatemalan GED/Equivalency Correlation Chart
The statistical analysis conducted on geographies consisting of 332,118,930 people shows a poor positive correlation between the proportion of Native Hawaiians and percentage of population with at least ged/equivalency education in the United States with a correlation coefficient (R) of 0.164 and weighted average of 87.5%. Similarly, the statistical analysis conducted on geographies consisting of 409,566,541 people shows a significant negative correlation between the proportion of Guatemalans and percentage of population with at least ged/equivalency education in the United States with a correlation coefficient (R) of -0.611 and weighted average of 78.5%, a difference of 11.5%.
GED/Equivalency Correlation Summary
| Measurement | Native Hawaiian | Guatemalan |
| Minimum | 78.4% | 17.6% |
| Maximum | 100.0% | 100.0% |
| Range | 21.6% | 82.4% |
| Mean | 89.1% | 68.3% |
| Median | 89.3% | 70.4% |
| Interquartile 25% (IQ1) | 86.7% | 62.3% |
| Interquartile 75% (IQ3) | 91.8% | 76.0% |
| Interquartile Range (IQR) | 5.1% | 13.7% |
| Standard Deviation (Sample) | 4.0% | 13.4% |
| Standard Deviation (Population) | 4.0% | 13.3% |
Similar Demographics by GED/Equivalency
Demographics Similar to Native Hawaiians by GED/Equivalency
In terms of ged/equivalency, the demographic groups most similar to Native Hawaiians are Immigrants from Europe (87.5%, a difference of 0.0%), Immigrants from Romania (87.5%, a difference of 0.010%), Dutch (87.5%, a difference of 0.010%), Immigrants from Norway (87.5%, a difference of 0.010%), and Hungarian (87.4%, a difference of 0.050%).
| Demographics | Rating | Rank | GED/Equivalency |
| Immigrants | England | 98.5 /100 | #80 | Exceptional 87.6% |
| Immigrants | Sri Lanka | 98.3 /100 | #81 | Exceptional 87.5% |
| Romanians | 98.3 /100 | #82 | Exceptional 87.5% |
| South Africans | 98.3 /100 | #83 | Exceptional 87.5% |
| Immigrants | Romania | 98.1 /100 | #84 | Exceptional 87.5% |
| Dutch | 98.1 /100 | #85 | Exceptional 87.5% |
| Immigrants | Europe | 98.1 /100 | #86 | Exceptional 87.5% |
| Native Hawaiians | 98.1 /100 | #87 | Exceptional 87.5% |
| Immigrants | Norway | 98.1 /100 | #88 | Exceptional 87.5% |
| Hungarians | 97.9 /100 | #89 | Exceptional 87.4% |
| Welsh | 97.9 /100 | #90 | Exceptional 87.4% |
| Immigrants | Eastern Asia | 97.9 /100 | #91 | Exceptional 87.4% |
| Israelis | 97.8 /100 | #92 | Exceptional 87.4% |
| Immigrants | North Macedonia | 97.8 /100 | #93 | Exceptional 87.4% |
| Immigrants | Russia | 97.8 /100 | #94 | Exceptional 87.4% |
Demographics Similar to Guatemalans by GED/Equivalency
In terms of ged/equivalency, the demographic groups most similar to Guatemalans are Immigrants from Latin America (78.5%, a difference of 0.020%), Salvadoran (78.6%, a difference of 0.080%), Immigrants from the Azores (78.7%, a difference of 0.20%), Immigrants from Honduras (78.7%, a difference of 0.31%), and Immigrants from Cabo Verde (78.9%, a difference of 0.55%).
| Demographics | Rating | Rank | GED/Equivalency |
| Central Americans | 0.0 /100 | #327 | Tragic 79.2% |
| Hispanics or Latinos | 0.0 /100 | #328 | Tragic 79.1% |
| Dominicans | 0.0 /100 | #329 | Tragic 79.1% |
| Immigrants | Cabo Verde | 0.0 /100 | #330 | Tragic 78.9% |
| Immigrants | Honduras | 0.0 /100 | #331 | Tragic 78.7% |
| Immigrants | Azores | 0.0 /100 | #332 | Tragic 78.7% |
| Salvadorans | 0.0 /100 | #333 | Tragic 78.6% |
| Guatemalans | 0.0 /100 | #334 | Tragic 78.5% |
| Immigrants | Latin America | 0.0 /100 | #335 | Tragic 78.5% |
| Immigrants | Dominican Republic | 0.0 /100 | #336 | Tragic 78.0% |
| Immigrants | Yemen | 0.0 /100 | #337 | Tragic 77.9% |
| Immigrants | Guatemala | 0.0 /100 | #338 | Tragic 77.9% |
| Immigrants | El Salvador | 0.0 /100 | #339 | Tragic 77.6% |
| Tohono O'odham | 0.0 /100 | #340 | Tragic 77.5% |
| Mexicans | 0.0 /100 | #341 | Tragic 77.4% |