Immigrants from Dominica vs Guatemalan GED/Equivalency
COMPARE
Immigrants from Dominica
Guatemalan
GED/Equivalency
GED/Equivalency Comparison
Immigrants from Dominica
Guatemalans
81.1%
GED/EQUIVALENCY
0.0/ 100
METRIC RATING
307th/ 347
METRIC RANK
78.5%
GED/EQUIVALENCY
0.0/ 100
METRIC RATING
334th/ 347
METRIC RANK
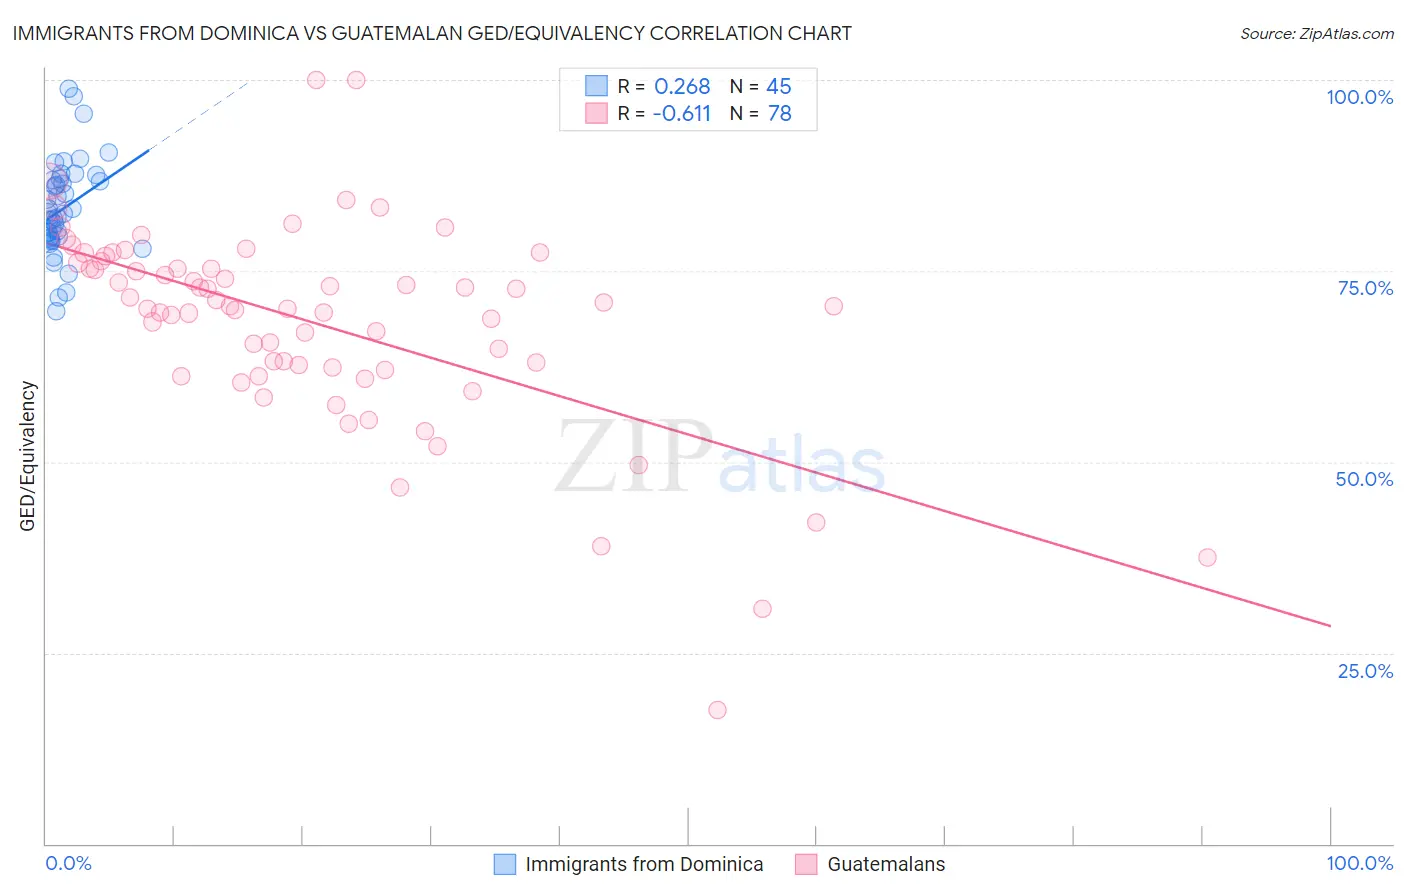
Immigrants from Dominica vs Guatemalan GED/Equivalency Correlation Chart
The statistical analysis conducted on geographies consisting of 83,794,115 people shows a weak positive correlation between the proportion of Immigrants from Dominica and percentage of population with at least ged/equivalency education in the United States with a correlation coefficient (R) of 0.268 and weighted average of 81.1%. Similarly, the statistical analysis conducted on geographies consisting of 409,566,541 people shows a significant negative correlation between the proportion of Guatemalans and percentage of population with at least ged/equivalency education in the United States with a correlation coefficient (R) of -0.611 and weighted average of 78.5%, a difference of 3.4%.
GED/Equivalency Correlation Summary
| Measurement | Immigrants from Dominica | Guatemalan |
| Minimum | 69.7% | 17.6% |
| Maximum | 98.8% | 100.0% |
| Range | 29.1% | 82.4% |
| Mean | 83.1% | 68.3% |
| Median | 82.5% | 70.4% |
| Interquartile 25% (IQ1) | 79.3% | 62.3% |
| Interquartile 75% (IQ3) | 87.0% | 76.0% |
| Interquartile Range (IQR) | 7.8% | 13.7% |
| Standard Deviation (Sample) | 6.2% | 13.4% |
| Standard Deviation (Population) | 6.2% | 13.3% |
Similar Demographics by GED/Equivalency
Demographics Similar to Immigrants from Dominica by GED/Equivalency
In terms of ged/equivalency, the demographic groups most similar to Immigrants from Dominica are Puerto Rican (81.1%, a difference of 0.10%), Guyanese (81.3%, a difference of 0.17%), Immigrants from Ecuador (81.0%, a difference of 0.18%), Immigrants from Grenada (81.3%, a difference of 0.19%), and Immigrants from Guyana (81.0%, a difference of 0.25%).
| Demographics | Rating | Rank | GED/Equivalency |
| Fijians | 0.0 /100 | #300 | Tragic 81.6% |
| Dutch West Indians | 0.0 /100 | #301 | Tragic 81.6% |
| Immigrants | Haiti | 0.0 /100 | #302 | Tragic 81.6% |
| Immigrants | Portugal | 0.0 /100 | #303 | Tragic 81.6% |
| Navajo | 0.0 /100 | #304 | Tragic 81.5% |
| Immigrants | Grenada | 0.0 /100 | #305 | Tragic 81.3% |
| Guyanese | 0.0 /100 | #306 | Tragic 81.3% |
| Immigrants | Dominica | 0.0 /100 | #307 | Tragic 81.1% |
| Puerto Ricans | 0.0 /100 | #308 | Tragic 81.1% |
| Immigrants | Ecuador | 0.0 /100 | #309 | Tragic 81.0% |
| Immigrants | Guyana | 0.0 /100 | #310 | Tragic 81.0% |
| Natives/Alaskans | 0.0 /100 | #311 | Tragic 80.9% |
| Nicaraguans | 0.0 /100 | #312 | Tragic 80.9% |
| Cape Verdeans | 0.0 /100 | #313 | Tragic 80.9% |
| Belizeans | 0.0 /100 | #314 | Tragic 80.9% |
Demographics Similar to Guatemalans by GED/Equivalency
In terms of ged/equivalency, the demographic groups most similar to Guatemalans are Immigrants from Latin America (78.5%, a difference of 0.020%), Salvadoran (78.6%, a difference of 0.080%), Immigrants from the Azores (78.7%, a difference of 0.20%), Immigrants from Honduras (78.7%, a difference of 0.31%), and Immigrants from Cabo Verde (78.9%, a difference of 0.55%).
| Demographics | Rating | Rank | GED/Equivalency |
| Central Americans | 0.0 /100 | #327 | Tragic 79.2% |
| Hispanics or Latinos | 0.0 /100 | #328 | Tragic 79.1% |
| Dominicans | 0.0 /100 | #329 | Tragic 79.1% |
| Immigrants | Cabo Verde | 0.0 /100 | #330 | Tragic 78.9% |
| Immigrants | Honduras | 0.0 /100 | #331 | Tragic 78.7% |
| Immigrants | Azores | 0.0 /100 | #332 | Tragic 78.7% |
| Salvadorans | 0.0 /100 | #333 | Tragic 78.6% |
| Guatemalans | 0.0 /100 | #334 | Tragic 78.5% |
| Immigrants | Latin America | 0.0 /100 | #335 | Tragic 78.5% |
| Immigrants | Dominican Republic | 0.0 /100 | #336 | Tragic 78.0% |
| Immigrants | Yemen | 0.0 /100 | #337 | Tragic 77.9% |
| Immigrants | Guatemala | 0.0 /100 | #338 | Tragic 77.9% |
| Immigrants | El Salvador | 0.0 /100 | #339 | Tragic 77.6% |
| Tohono O'odham | 0.0 /100 | #340 | Tragic 77.5% |
| Mexicans | 0.0 /100 | #341 | Tragic 77.4% |