Immigrants from Greece vs American GED/Equivalency
COMPARE
Immigrants from Greece
American
GED/Equivalency
GED/Equivalency Comparison
Immigrants from Greece
Americans
87.4%
GED/EQUIVALENCY
97.7/ 100
METRIC RATING
95th/ 347
METRIC RANK
84.7%
GED/EQUIVALENCY
8.2/ 100
METRIC RATING
220th/ 347
METRIC RANK
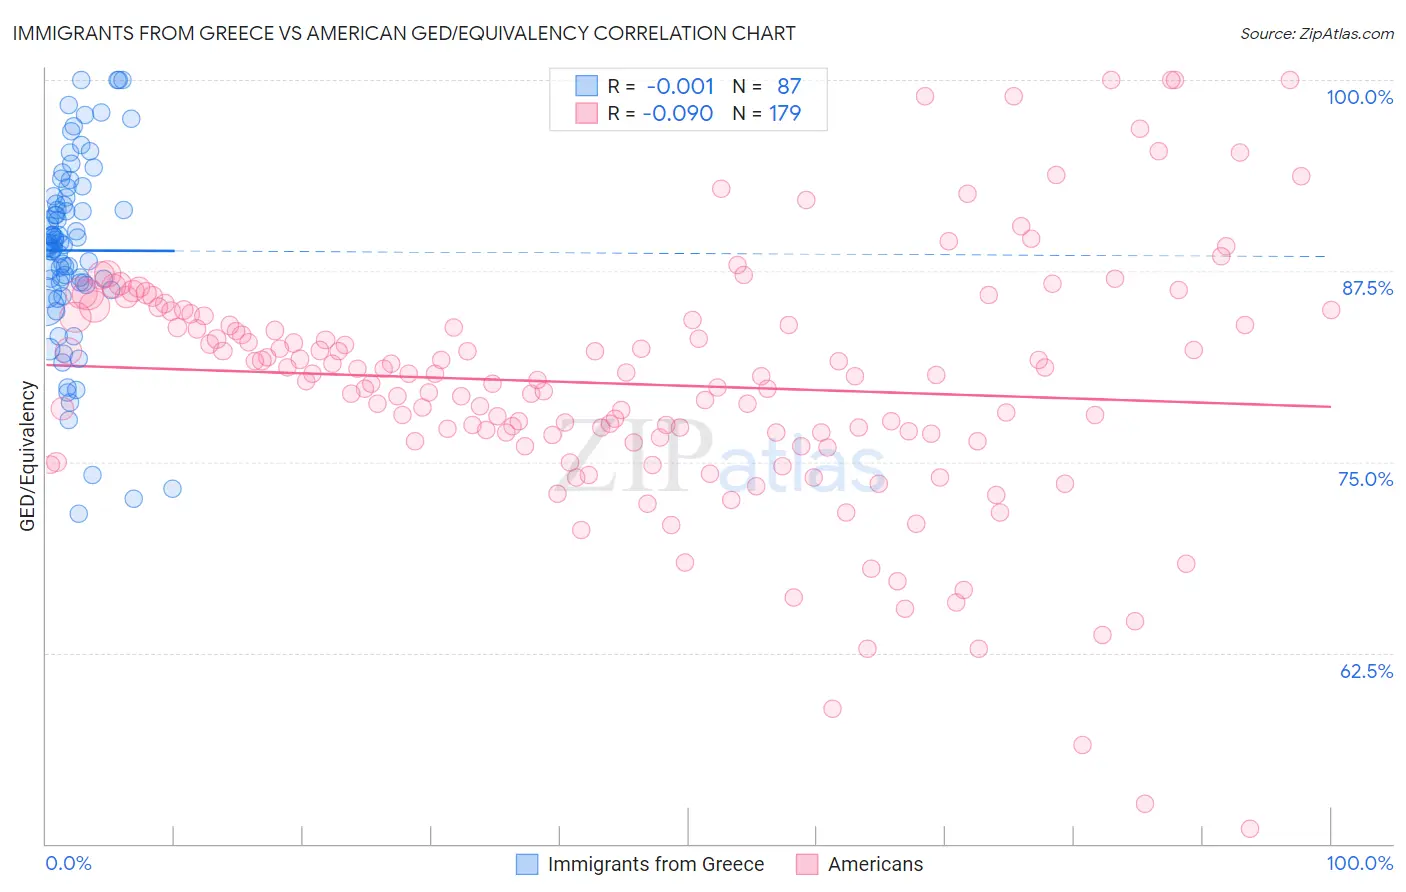
Immigrants from Greece vs American GED/Equivalency Correlation Chart
The statistical analysis conducted on geographies consisting of 216,879,847 people shows no correlation between the proportion of Immigrants from Greece and percentage of population with at least ged/equivalency education in the United States with a correlation coefficient (R) of -0.001 and weighted average of 87.4%. Similarly, the statistical analysis conducted on geographies consisting of 581,992,908 people shows a slight negative correlation between the proportion of Americans and percentage of population with at least ged/equivalency education in the United States with a correlation coefficient (R) of -0.090 and weighted average of 84.7%, a difference of 3.2%.
GED/Equivalency Correlation Summary
| Measurement | Immigrants from Greece | American |
| Minimum | 71.6% | 51.0% |
| Maximum | 100.0% | 100.0% |
| Range | 28.4% | 49.0% |
| Mean | 88.8% | 80.1% |
| Median | 89.3% | 80.6% |
| Interquartile 25% (IQ1) | 86.6% | 76.6% |
| Interquartile 75% (IQ3) | 92.3% | 84.5% |
| Interquartile Range (IQR) | 5.7% | 7.9% |
| Standard Deviation (Sample) | 6.1% | 8.2% |
| Standard Deviation (Population) | 6.1% | 8.2% |
Similar Demographics by GED/Equivalency
Demographics Similar to Immigrants from Greece by GED/Equivalency
In terms of ged/equivalency, the demographic groups most similar to Immigrants from Greece are Immigrants from North Macedonia (87.4%, a difference of 0.020%), Immigrants from Russia (87.4%, a difference of 0.020%), Czechoslovakian (87.4%, a difference of 0.020%), Israeli (87.4%, a difference of 0.030%), and Immigrants from Eastern Asia (87.4%, a difference of 0.040%).
| Demographics | Rating | Rank | GED/Equivalency |
| Immigrants | Norway | 98.1 /100 | #88 | Exceptional 87.5% |
| Hungarians | 97.9 /100 | #89 | Exceptional 87.4% |
| Welsh | 97.9 /100 | #90 | Exceptional 87.4% |
| Immigrants | Eastern Asia | 97.9 /100 | #91 | Exceptional 87.4% |
| Israelis | 97.8 /100 | #92 | Exceptional 87.4% |
| Immigrants | North Macedonia | 97.8 /100 | #93 | Exceptional 87.4% |
| Immigrants | Russia | 97.8 /100 | #94 | Exceptional 87.4% |
| Immigrants | Greece | 97.7 /100 | #95 | Exceptional 87.4% |
| Czechoslovakians | 97.6 /100 | #96 | Exceptional 87.4% |
| Immigrants | Western Europe | 97.3 /100 | #97 | Exceptional 87.3% |
| Immigrants | Croatia | 96.9 /100 | #98 | Exceptional 87.3% |
| Immigrants | Belarus | 96.9 /100 | #99 | Exceptional 87.3% |
| Palestinians | 96.8 /100 | #100 | Exceptional 87.3% |
| Syrians | 96.6 /100 | #101 | Exceptional 87.2% |
| Lebanese | 96.2 /100 | #102 | Exceptional 87.2% |
Demographics Similar to Americans by GED/Equivalency
In terms of ged/equivalency, the demographic groups most similar to Americans are Potawatomi (84.7%, a difference of 0.0%), Taiwanese (84.7%, a difference of 0.010%), Immigrants from Micronesia (84.7%, a difference of 0.030%), Nigerian (84.7%, a difference of 0.030%), and Alaska Native (84.7%, a difference of 0.030%).
| Demographics | Rating | Rank | GED/Equivalency |
| Immigrants | Philippines | 10.0 /100 | #213 | Poor 84.8% |
| Osage | 9.5 /100 | #214 | Tragic 84.8% |
| Peruvians | 9.2 /100 | #215 | Tragic 84.7% |
| Immigrants | Micronesia | 8.7 /100 | #216 | Tragic 84.7% |
| Nigerians | 8.6 /100 | #217 | Tragic 84.7% |
| Alaska Natives | 8.6 /100 | #218 | Tragic 84.7% |
| Potawatomi | 8.2 /100 | #219 | Tragic 84.7% |
| Americans | 8.2 /100 | #220 | Tragic 84.7% |
| Taiwanese | 8.1 /100 | #221 | Tragic 84.7% |
| Iroquois | 7.5 /100 | #222 | Tragic 84.6% |
| Immigrants | Uzbekistan | 7.1 /100 | #223 | Tragic 84.6% |
| French American Indians | 6.3 /100 | #224 | Tragic 84.6% |
| Immigrants | Thailand | 5.8 /100 | #225 | Tragic 84.5% |
| Immigrants | Zaire | 5.5 /100 | #226 | Tragic 84.5% |
| Immigrants | Costa Rica | 5.4 /100 | #227 | Tragic 84.5% |