Immigrants from Greece vs French GED/Equivalency
COMPARE
Immigrants from Greece
French
GED/Equivalency
GED/Equivalency Comparison
Immigrants from Greece
French
87.4%
GED/EQUIVALENCY
97.7/ 100
METRIC RATING
95th/ 347
METRIC RANK
87.1%
GED/EQUIVALENCY
95.2/ 100
METRIC RATING
111th/ 347
METRIC RANK
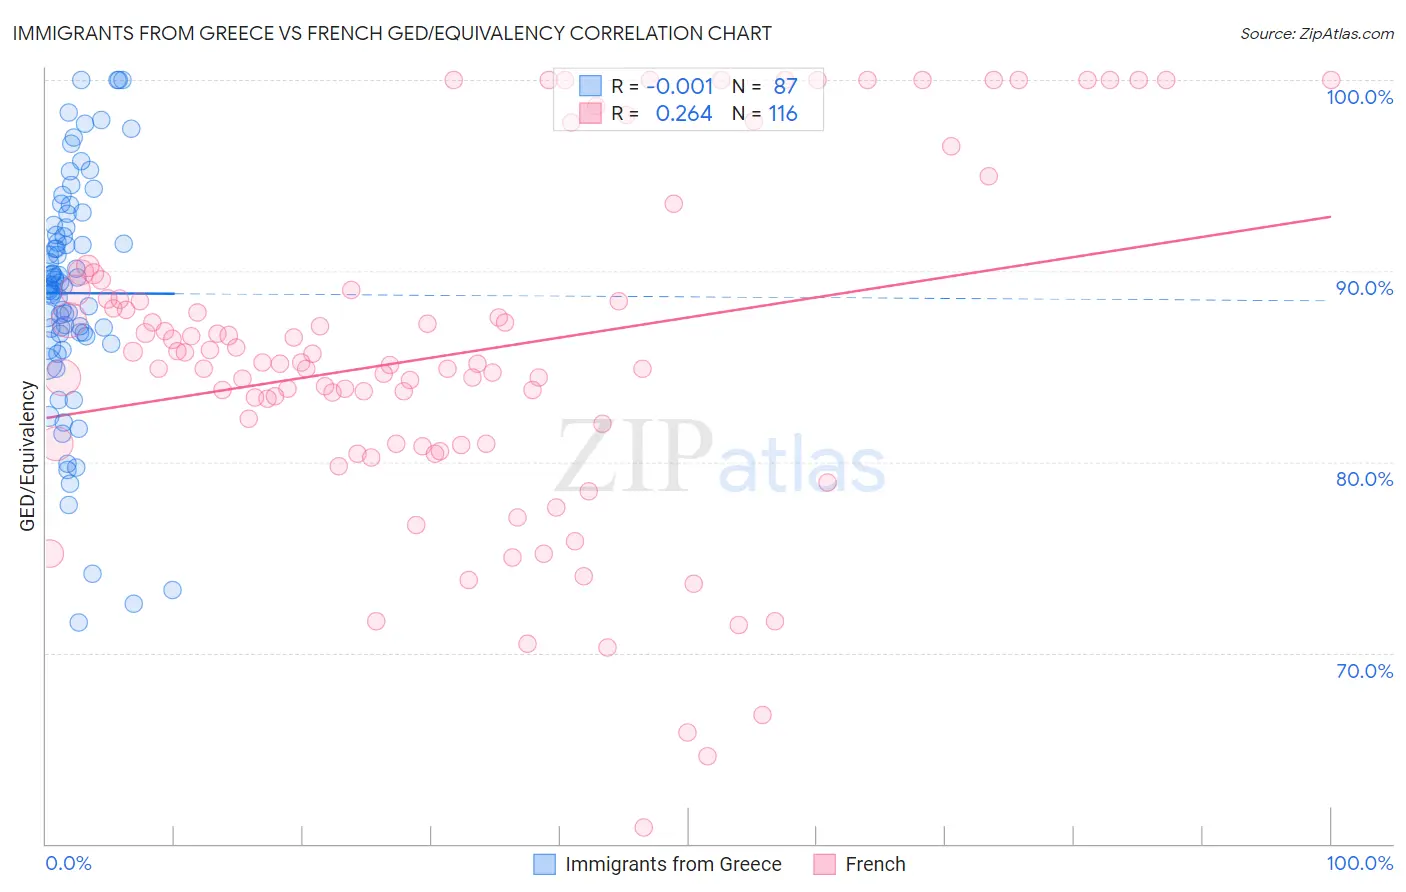
Immigrants from Greece vs French GED/Equivalency Correlation Chart
The statistical analysis conducted on geographies consisting of 216,879,847 people shows no correlation between the proportion of Immigrants from Greece and percentage of population with at least ged/equivalency education in the United States with a correlation coefficient (R) of -0.001 and weighted average of 87.4%. Similarly, the statistical analysis conducted on geographies consisting of 572,427,361 people shows a weak positive correlation between the proportion of French and percentage of population with at least ged/equivalency education in the United States with a correlation coefficient (R) of 0.264 and weighted average of 87.1%, a difference of 0.38%.
GED/Equivalency Correlation Summary
| Measurement | Immigrants from Greece | French |
| Minimum | 71.6% | 60.9% |
| Maximum | 100.0% | 100.0% |
| Range | 28.4% | 39.1% |
| Mean | 88.8% | 85.6% |
| Median | 89.3% | 85.2% |
| Interquartile 25% (IQ1) | 86.6% | 81.0% |
| Interquartile 75% (IQ3) | 92.3% | 88.8% |
| Interquartile Range (IQR) | 5.7% | 7.8% |
| Standard Deviation (Sample) | 6.1% | 8.7% |
| Standard Deviation (Population) | 6.1% | 8.7% |
Demographics Similar to Immigrants from Greece and French by GED/Equivalency
In terms of ged/equivalency, the demographic groups most similar to Immigrants from Greece are Immigrants from North Macedonia (87.4%, a difference of 0.020%), Immigrants from Russia (87.4%, a difference of 0.020%), Czechoslovakian (87.4%, a difference of 0.020%), Immigrants from Western Europe (87.3%, a difference of 0.090%), and Immigrants from Croatia (87.3%, a difference of 0.15%). Similarly, the demographic groups most similar to French are Egyptian (87.1%, a difference of 0.0%), Immigrants from Eastern Europe (87.1%, a difference of 0.030%), Canadian (87.1%, a difference of 0.040%), Tlingit-Haida (87.0%, a difference of 0.050%), and Assyrian/Chaldean/Syriac (87.0%, a difference of 0.050%).
| Demographics | Rating | Rank | GED/Equivalency |
| Immigrants | North Macedonia | 97.8 /100 | #93 | Exceptional 87.4% |
| Immigrants | Russia | 97.8 /100 | #94 | Exceptional 87.4% |
| Immigrants | Greece | 97.7 /100 | #95 | Exceptional 87.4% |
| Czechoslovakians | 97.6 /100 | #96 | Exceptional 87.4% |
| Immigrants | Western Europe | 97.3 /100 | #97 | Exceptional 87.3% |
| Immigrants | Croatia | 96.9 /100 | #98 | Exceptional 87.3% |
| Immigrants | Belarus | 96.9 /100 | #99 | Exceptional 87.3% |
| Palestinians | 96.8 /100 | #100 | Exceptional 87.3% |
| Syrians | 96.6 /100 | #101 | Exceptional 87.2% |
| Lebanese | 96.2 /100 | #102 | Exceptional 87.2% |
| Jordanians | 96.1 /100 | #103 | Exceptional 87.2% |
| Immigrants | Hungary | 96.0 /100 | #104 | Exceptional 87.2% |
| Indians (Asian) | 95.9 /100 | #105 | Exceptional 87.1% |
| Immigrants | Zimbabwe | 95.8 /100 | #106 | Exceptional 87.1% |
| Icelanders | 95.7 /100 | #107 | Exceptional 87.1% |
| Canadians | 95.6 /100 | #108 | Exceptional 87.1% |
| Immigrants | Eastern Europe | 95.5 /100 | #109 | Exceptional 87.1% |
| Egyptians | 95.3 /100 | #110 | Exceptional 87.1% |
| French | 95.2 /100 | #111 | Exceptional 87.1% |
| Tlingit-Haida | 94.8 /100 | #112 | Exceptional 87.0% |
| Assyrians/Chaldeans/Syriacs | 94.8 /100 | #113 | Exceptional 87.0% |