Immigrants from West Indies vs American GED/Equivalency
COMPARE
Immigrants from West Indies
American
GED/Equivalency
GED/Equivalency Comparison
Immigrants from West Indies
Americans
82.4%
GED/EQUIVALENCY
0.0/ 100
METRIC RATING
286th/ 347
METRIC RANK
84.7%
GED/EQUIVALENCY
8.2/ 100
METRIC RATING
220th/ 347
METRIC RANK
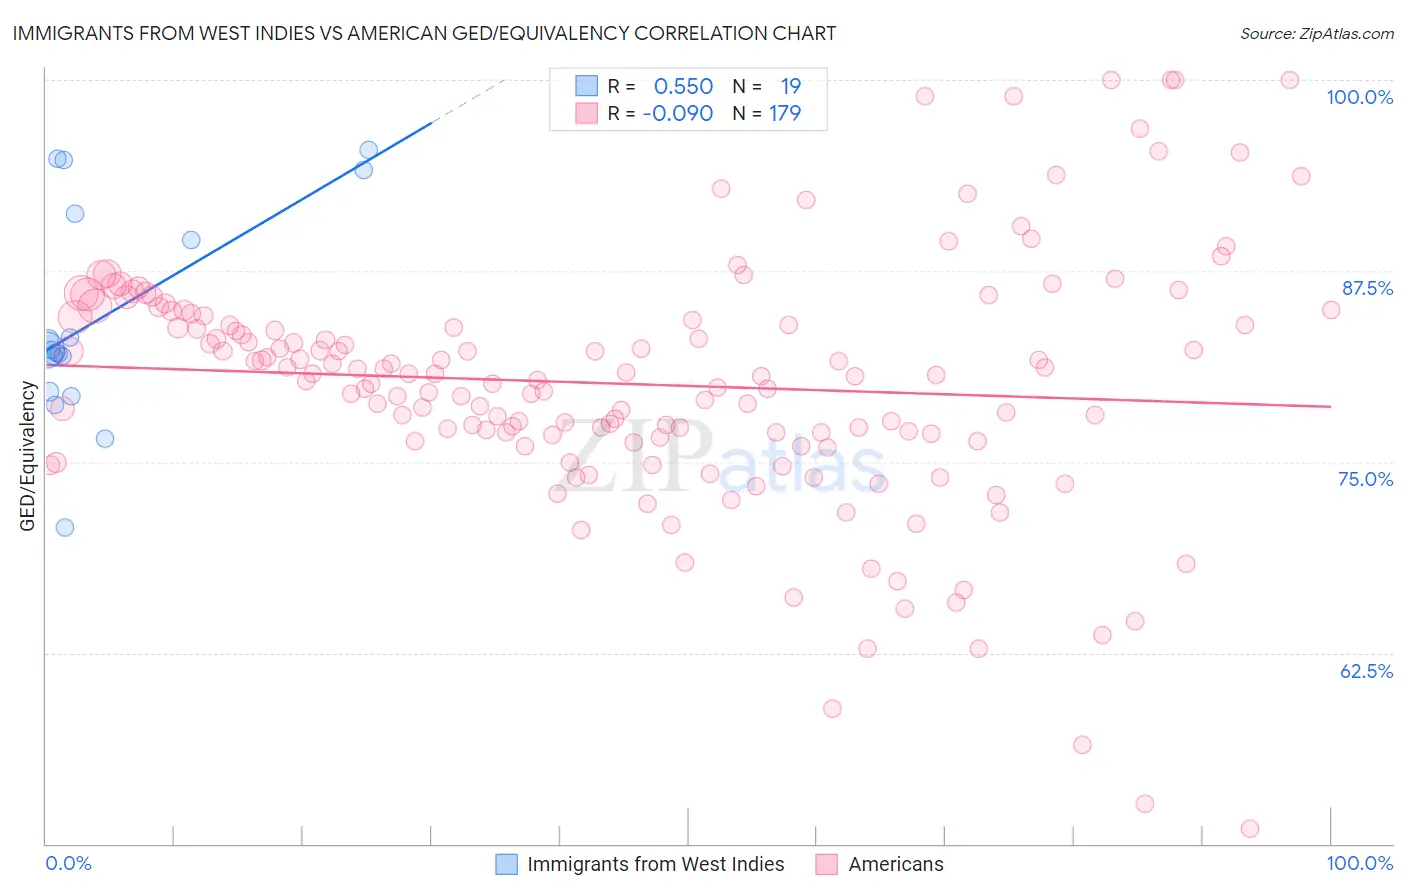
Immigrants from West Indies vs American GED/Equivalency Correlation Chart
The statistical analysis conducted on geographies consisting of 72,457,514 people shows a substantial positive correlation between the proportion of Immigrants from West Indies and percentage of population with at least ged/equivalency education in the United States with a correlation coefficient (R) of 0.550 and weighted average of 82.4%. Similarly, the statistical analysis conducted on geographies consisting of 581,992,908 people shows a slight negative correlation between the proportion of Americans and percentage of population with at least ged/equivalency education in the United States with a correlation coefficient (R) of -0.090 and weighted average of 84.7%, a difference of 2.8%.
GED/Equivalency Correlation Summary
| Measurement | Immigrants from West Indies | American |
| Minimum | 70.7% | 51.0% |
| Maximum | 95.4% | 100.0% |
| Range | 24.7% | 49.0% |
| Mean | 84.4% | 80.1% |
| Median | 82.3% | 80.6% |
| Interquartile 25% (IQ1) | 79.6% | 76.6% |
| Interquartile 75% (IQ3) | 91.2% | 84.5% |
| Interquartile Range (IQR) | 11.7% | 7.9% |
| Standard Deviation (Sample) | 7.0% | 8.2% |
| Standard Deviation (Population) | 6.8% | 8.2% |
Similar Demographics by GED/Equivalency
Demographics Similar to Immigrants from West Indies by GED/Equivalency
In terms of ged/equivalency, the demographic groups most similar to Immigrants from West Indies are Cajun (82.4%, a difference of 0.020%), Japanese (82.4%, a difference of 0.020%), Immigrants from Barbados (82.4%, a difference of 0.060%), Pueblo (82.3%, a difference of 0.12%), and Indonesian (82.5%, a difference of 0.18%).
| Demographics | Rating | Rank | GED/Equivalency |
| Immigrants | Fiji | 0.1 /100 | #279 | Tragic 82.7% |
| Cheyenne | 0.1 /100 | #280 | Tragic 82.7% |
| Sioux | 0.1 /100 | #281 | Tragic 82.6% |
| Immigrants | Immigrants | 0.1 /100 | #282 | Tragic 82.6% |
| Indonesians | 0.1 /100 | #283 | Tragic 82.5% |
| Immigrants | Barbados | 0.1 /100 | #284 | Tragic 82.4% |
| Cajuns | 0.0 /100 | #285 | Tragic 82.4% |
| Immigrants | West Indies | 0.0 /100 | #286 | Tragic 82.4% |
| Japanese | 0.0 /100 | #287 | Tragic 82.4% |
| Pueblo | 0.0 /100 | #288 | Tragic 82.3% |
| Immigrants | Cambodia | 0.0 /100 | #289 | Tragic 82.2% |
| Haitians | 0.0 /100 | #290 | Tragic 82.1% |
| Cubans | 0.0 /100 | #291 | Tragic 82.0% |
| Paiute | 0.0 /100 | #292 | Tragic 82.0% |
| British West Indians | 0.0 /100 | #293 | Tragic 82.0% |
Demographics Similar to Americans by GED/Equivalency
In terms of ged/equivalency, the demographic groups most similar to Americans are Potawatomi (84.7%, a difference of 0.0%), Taiwanese (84.7%, a difference of 0.010%), Immigrants from Micronesia (84.7%, a difference of 0.030%), Nigerian (84.7%, a difference of 0.030%), and Alaska Native (84.7%, a difference of 0.030%).
| Demographics | Rating | Rank | GED/Equivalency |
| Immigrants | Philippines | 10.0 /100 | #213 | Poor 84.8% |
| Osage | 9.5 /100 | #214 | Tragic 84.8% |
| Peruvians | 9.2 /100 | #215 | Tragic 84.7% |
| Immigrants | Micronesia | 8.7 /100 | #216 | Tragic 84.7% |
| Nigerians | 8.6 /100 | #217 | Tragic 84.7% |
| Alaska Natives | 8.6 /100 | #218 | Tragic 84.7% |
| Potawatomi | 8.2 /100 | #219 | Tragic 84.7% |
| Americans | 8.2 /100 | #220 | Tragic 84.7% |
| Taiwanese | 8.1 /100 | #221 | Tragic 84.7% |
| Iroquois | 7.5 /100 | #222 | Tragic 84.6% |
| Immigrants | Uzbekistan | 7.1 /100 | #223 | Tragic 84.6% |
| French American Indians | 6.3 /100 | #224 | Tragic 84.6% |
| Immigrants | Thailand | 5.8 /100 | #225 | Tragic 84.5% |
| Immigrants | Zaire | 5.5 /100 | #226 | Tragic 84.5% |
| Immigrants | Costa Rica | 5.4 /100 | #227 | Tragic 84.5% |