Immigrants from Eritrea vs Zimbabwean Master's Degree
COMPARE
Immigrants from Eritrea
Zimbabwean
Master's Degree
Master's Degree Comparison
Immigrants from Eritrea
Zimbabweans
16.4%
MASTER'S DEGREE
95.5/ 100
METRIC RATING
124th/ 347
METRIC RANK
17.7%
MASTER'S DEGREE
99.7/ 100
METRIC RATING
73rd/ 347
METRIC RANK
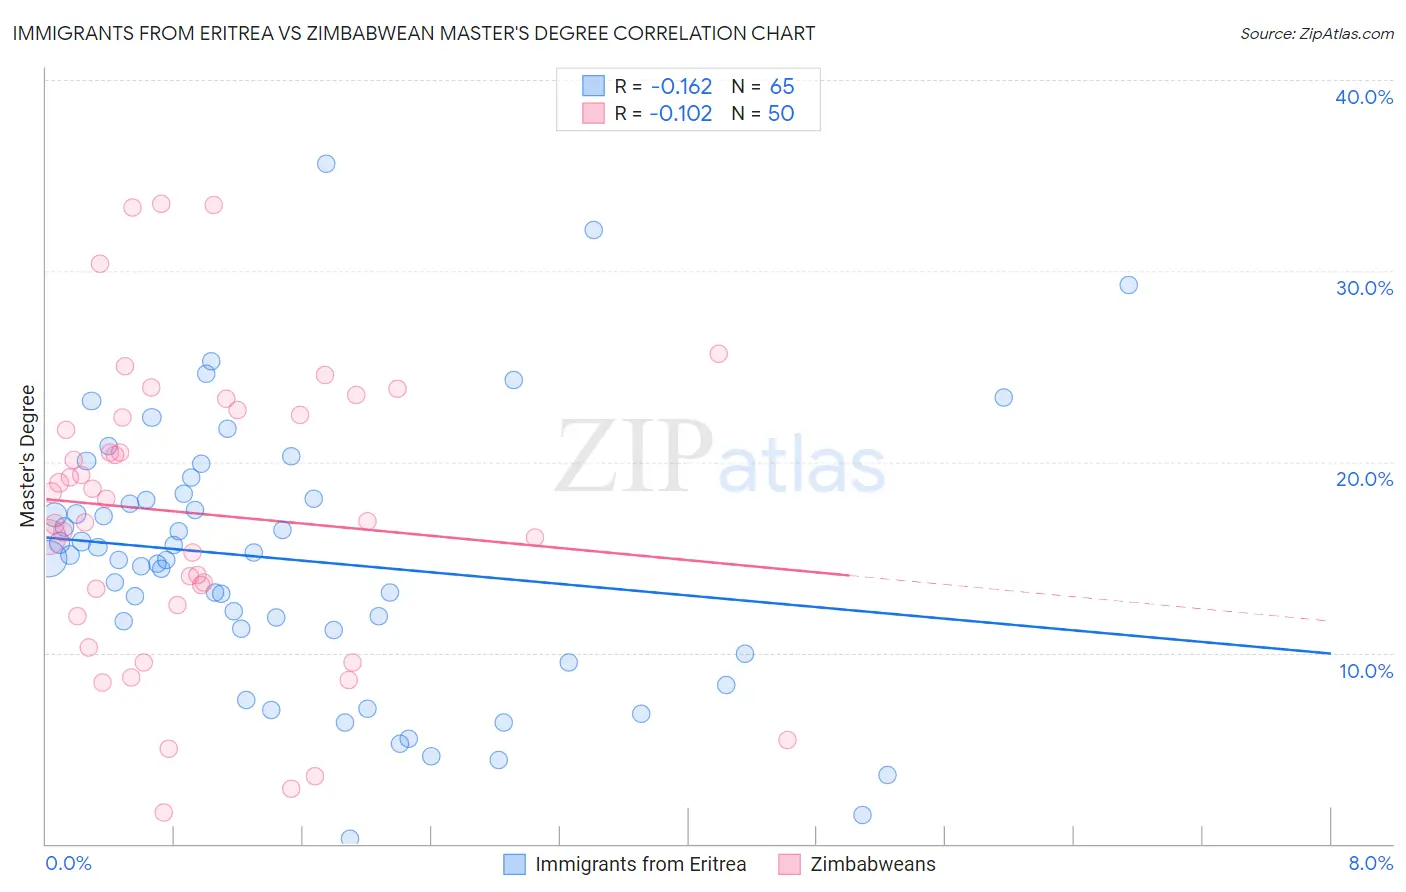
Immigrants from Eritrea vs Zimbabwean Master's Degree Correlation Chart
The statistical analysis conducted on geographies consisting of 104,847,630 people shows a poor negative correlation between the proportion of Immigrants from Eritrea and percentage of population with at least master's degree education in the United States with a correlation coefficient (R) of -0.162 and weighted average of 16.4%. Similarly, the statistical analysis conducted on geographies consisting of 69,201,212 people shows a poor negative correlation between the proportion of Zimbabweans and percentage of population with at least master's degree education in the United States with a correlation coefficient (R) of -0.102 and weighted average of 17.7%, a difference of 8.2%.
Master's Degree Correlation Summary
| Measurement | Immigrants from Eritrea | Zimbabwean |
| Minimum | 0.25% | 1.7% |
| Maximum | 35.6% | 33.5% |
| Range | 35.4% | 31.8% |
| Mean | 14.8% | 17.3% |
| Median | 15.0% | 17.5% |
| Interquartile 25% (IQ1) | 10.6% | 12.5% |
| Interquartile 75% (IQ3) | 18.2% | 22.4% |
| Interquartile Range (IQR) | 7.6% | 9.9% |
| Standard Deviation (Sample) | 7.0% | 7.7% |
| Standard Deviation (Population) | 7.0% | 7.6% |
Similar Demographics by Master's Degree
Demographics Similar to Immigrants from Eritrea by Master's Degree
In terms of master's degree, the demographic groups most similar to Immigrants from Eritrea are Croatian (16.4%, a difference of 0.070%), Italian (16.4%, a difference of 0.070%), British (16.4%, a difference of 0.080%), Immigrants from Eastern Africa (16.3%, a difference of 0.19%), and Palestinian (16.3%, a difference of 0.45%).
| Demographics | Rating | Rank | Master's Degree |
| Immigrants | Moldova | 97.2 /100 | #117 | Exceptional 16.6% |
| Brazilians | 96.8 /100 | #118 | Exceptional 16.5% |
| Jordanians | 96.5 /100 | #119 | Exceptional 16.5% |
| Lebanese | 96.4 /100 | #120 | Exceptional 16.5% |
| Afghans | 96.2 /100 | #121 | Exceptional 16.5% |
| British | 95.6 /100 | #122 | Exceptional 16.4% |
| Croatians | 95.6 /100 | #123 | Exceptional 16.4% |
| Immigrants | Eritrea | 95.5 /100 | #124 | Exceptional 16.4% |
| Italians | 95.4 /100 | #125 | Exceptional 16.4% |
| Immigrants | Eastern Africa | 95.2 /100 | #126 | Exceptional 16.3% |
| Palestinians | 94.8 /100 | #127 | Exceptional 16.3% |
| Immigrants | Sierra Leone | 94.7 /100 | #128 | Exceptional 16.3% |
| Immigrants | Syria | 93.3 /100 | #129 | Exceptional 16.2% |
| Immigrants | Jordan | 92.7 /100 | #130 | Exceptional 16.1% |
| Taiwanese | 91.9 /100 | #131 | Exceptional 16.1% |
Demographics Similar to Zimbabweans by Master's Degree
In terms of master's degree, the demographic groups most similar to Zimbabweans are Lithuanian (17.7%, a difference of 0.11%), Immigrants from Pakistan (17.8%, a difference of 0.28%), Immigrants from Romania (17.7%, a difference of 0.31%), Immigrants from Western Europe (17.8%, a difference of 0.57%), and Egyptian (17.6%, a difference of 0.69%).
| Demographics | Rating | Rank | Master's Degree |
| Ethiopians | 99.8 /100 | #66 | Exceptional 18.0% |
| Immigrants | Argentina | 99.8 /100 | #67 | Exceptional 18.0% |
| Immigrants | Ethiopia | 99.8 /100 | #68 | Exceptional 17.9% |
| Immigrants | Uzbekistan | 99.8 /100 | #69 | Exceptional 17.9% |
| Immigrants | Western Europe | 99.8 /100 | #70 | Exceptional 17.8% |
| Immigrants | Pakistan | 99.7 /100 | #71 | Exceptional 17.8% |
| Lithuanians | 99.7 /100 | #72 | Exceptional 17.7% |
| Zimbabweans | 99.7 /100 | #73 | Exceptional 17.7% |
| Immigrants | Romania | 99.7 /100 | #74 | Exceptional 17.7% |
| Egyptians | 99.6 /100 | #75 | Exceptional 17.6% |
| Immigrants | Indonesia | 99.6 /100 | #76 | Exceptional 17.6% |
| Immigrants | Eastern Europe | 99.6 /100 | #77 | Exceptional 17.6% |
| Immigrants | Hungary | 99.6 /100 | #78 | Exceptional 17.5% |
| Immigrants | Lebanon | 99.6 /100 | #79 | Exceptional 17.5% |
| Carpatho Rusyns | 99.6 /100 | #80 | Exceptional 17.5% |