Houma vs Zimbabwean Master's Degree
COMPARE
Houma
Zimbabwean
Master's Degree
Master's Degree Comparison
Houma
Zimbabweans
7.9%
MASTER'S DEGREE
0.0/ 100
METRIC RATING
347th/ 347
METRIC RANK
17.7%
MASTER'S DEGREE
99.7/ 100
METRIC RATING
73rd/ 347
METRIC RANK
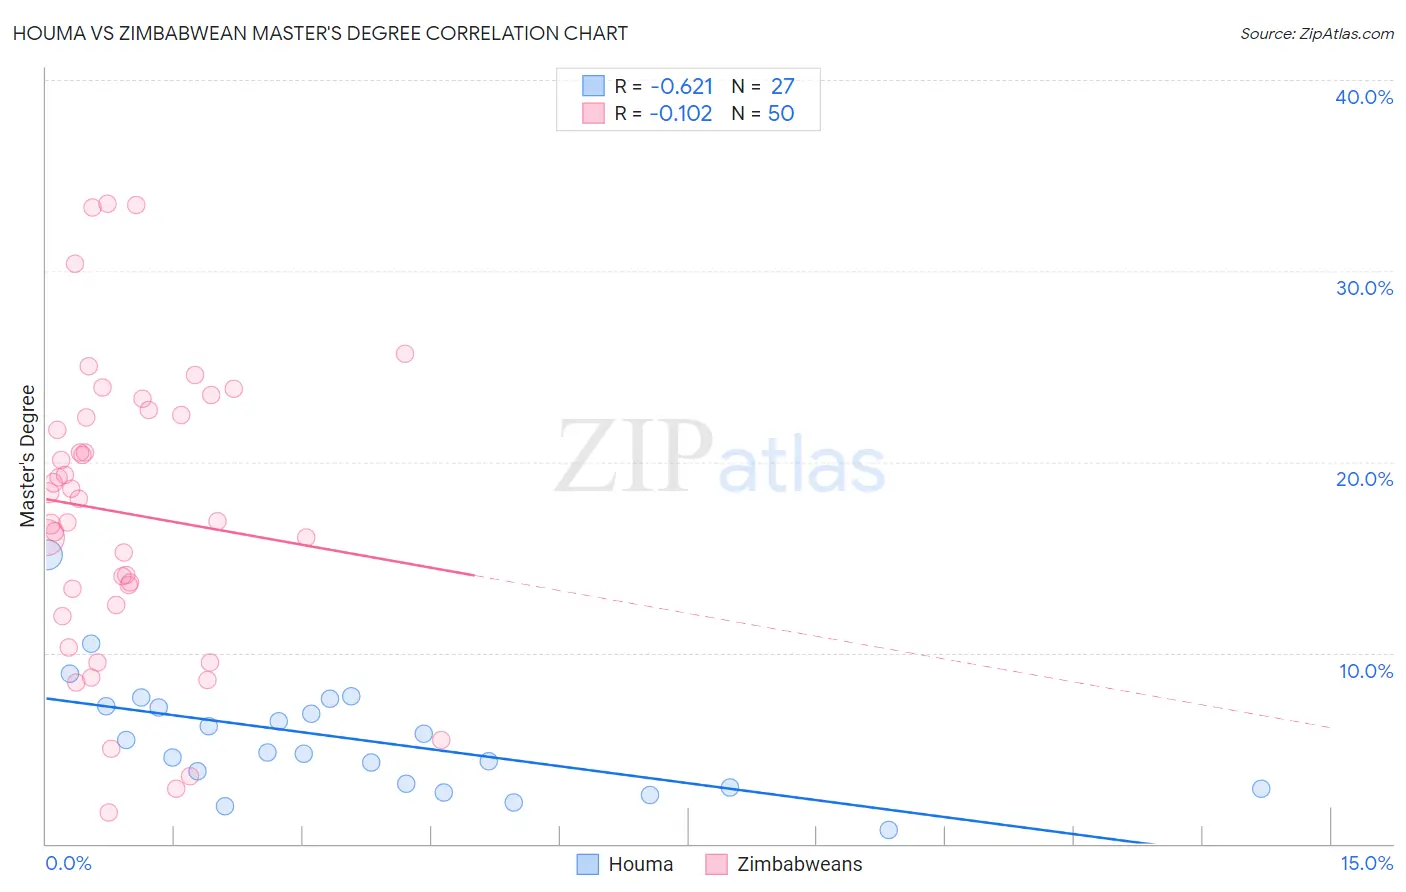
Houma vs Zimbabwean Master's Degree Correlation Chart
The statistical analysis conducted on geographies consisting of 36,787,451 people shows a significant negative correlation between the proportion of Houma and percentage of population with at least master's degree education in the United States with a correlation coefficient (R) of -0.621 and weighted average of 7.9%. Similarly, the statistical analysis conducted on geographies consisting of 69,201,212 people shows a poor negative correlation between the proportion of Zimbabweans and percentage of population with at least master's degree education in the United States with a correlation coefficient (R) of -0.102 and weighted average of 17.7%, a difference of 124.0%.
Master's Degree Correlation Summary
| Measurement | Houma | Zimbabwean |
| Minimum | 0.74% | 1.7% |
| Maximum | 15.1% | 33.5% |
| Range | 14.4% | 31.8% |
| Mean | 5.5% | 17.3% |
| Median | 4.8% | 17.5% |
| Interquartile 25% (IQ1) | 3.0% | 12.5% |
| Interquartile 75% (IQ3) | 7.2% | 22.4% |
| Interquartile Range (IQR) | 4.2% | 9.9% |
| Standard Deviation (Sample) | 3.0% | 7.7% |
| Standard Deviation (Population) | 3.0% | 7.6% |
Similar Demographics by Master's Degree
Demographics Similar to Houma by Master's Degree
In terms of master's degree, the demographic groups most similar to Houma are Yup'ik (8.5%, a difference of 8.0%), Yuman (9.2%, a difference of 16.7%), Pima (9.2%, a difference of 16.9%), Lumbee (9.3%, a difference of 17.1%), and Immigrants from Mexico (9.3%, a difference of 17.6%).
| Demographics | Rating | Rank | Master's Degree |
| Menominee | 0.0 /100 | #333 | Tragic 10.2% |
| Arapaho | 0.0 /100 | #334 | Tragic 10.0% |
| Immigrants | Central America | 0.0 /100 | #335 | Tragic 10.0% |
| Natives/Alaskans | 0.0 /100 | #336 | Tragic 9.9% |
| Mexicans | 0.0 /100 | #337 | Tragic 9.7% |
| Tohono O'odham | 0.0 /100 | #338 | Tragic 9.7% |
| Spanish American Indians | 0.0 /100 | #339 | Tragic 9.6% |
| Yakama | 0.0 /100 | #340 | Tragic 9.5% |
| Navajo | 0.0 /100 | #341 | Tragic 9.4% |
| Immigrants | Mexico | 0.0 /100 | #342 | Tragic 9.3% |
| Lumbee | 0.0 /100 | #343 | Tragic 9.3% |
| Pima | 0.0 /100 | #344 | Tragic 9.2% |
| Yuman | 0.0 /100 | #345 | Tragic 9.2% |
| Yup'ik | 0.0 /100 | #346 | Tragic 8.5% |
| Houma | 0.0 /100 | #347 | Tragic 7.9% |
Demographics Similar to Zimbabweans by Master's Degree
In terms of master's degree, the demographic groups most similar to Zimbabweans are Lithuanian (17.7%, a difference of 0.11%), Immigrants from Pakistan (17.8%, a difference of 0.28%), Immigrants from Romania (17.7%, a difference of 0.31%), Immigrants from Western Europe (17.8%, a difference of 0.57%), and Egyptian (17.6%, a difference of 0.69%).
| Demographics | Rating | Rank | Master's Degree |
| Ethiopians | 99.8 /100 | #66 | Exceptional 18.0% |
| Immigrants | Argentina | 99.8 /100 | #67 | Exceptional 18.0% |
| Immigrants | Ethiopia | 99.8 /100 | #68 | Exceptional 17.9% |
| Immigrants | Uzbekistan | 99.8 /100 | #69 | Exceptional 17.9% |
| Immigrants | Western Europe | 99.8 /100 | #70 | Exceptional 17.8% |
| Immigrants | Pakistan | 99.7 /100 | #71 | Exceptional 17.8% |
| Lithuanians | 99.7 /100 | #72 | Exceptional 17.7% |
| Zimbabweans | 99.7 /100 | #73 | Exceptional 17.7% |
| Immigrants | Romania | 99.7 /100 | #74 | Exceptional 17.7% |
| Egyptians | 99.6 /100 | #75 | Exceptional 17.6% |
| Immigrants | Indonesia | 99.6 /100 | #76 | Exceptional 17.6% |
| Immigrants | Eastern Europe | 99.6 /100 | #77 | Exceptional 17.6% |
| Immigrants | Hungary | 99.6 /100 | #78 | Exceptional 17.5% |
| Immigrants | Lebanon | 99.6 /100 | #79 | Exceptional 17.5% |
| Carpatho Rusyns | 99.6 /100 | #80 | Exceptional 17.5% |