Immigrants from Eritrea vs Central American Indian Master's Degree
COMPARE
Immigrants from Eritrea
Central American Indian
Master's Degree
Master's Degree Comparison
Immigrants from Eritrea
Central American Indians
16.4%
MASTER'S DEGREE
95.5/ 100
METRIC RATING
124th/ 347
METRIC RANK
12.4%
MASTER'S DEGREE
0.5/ 100
METRIC RATING
263rd/ 347
METRIC RANK
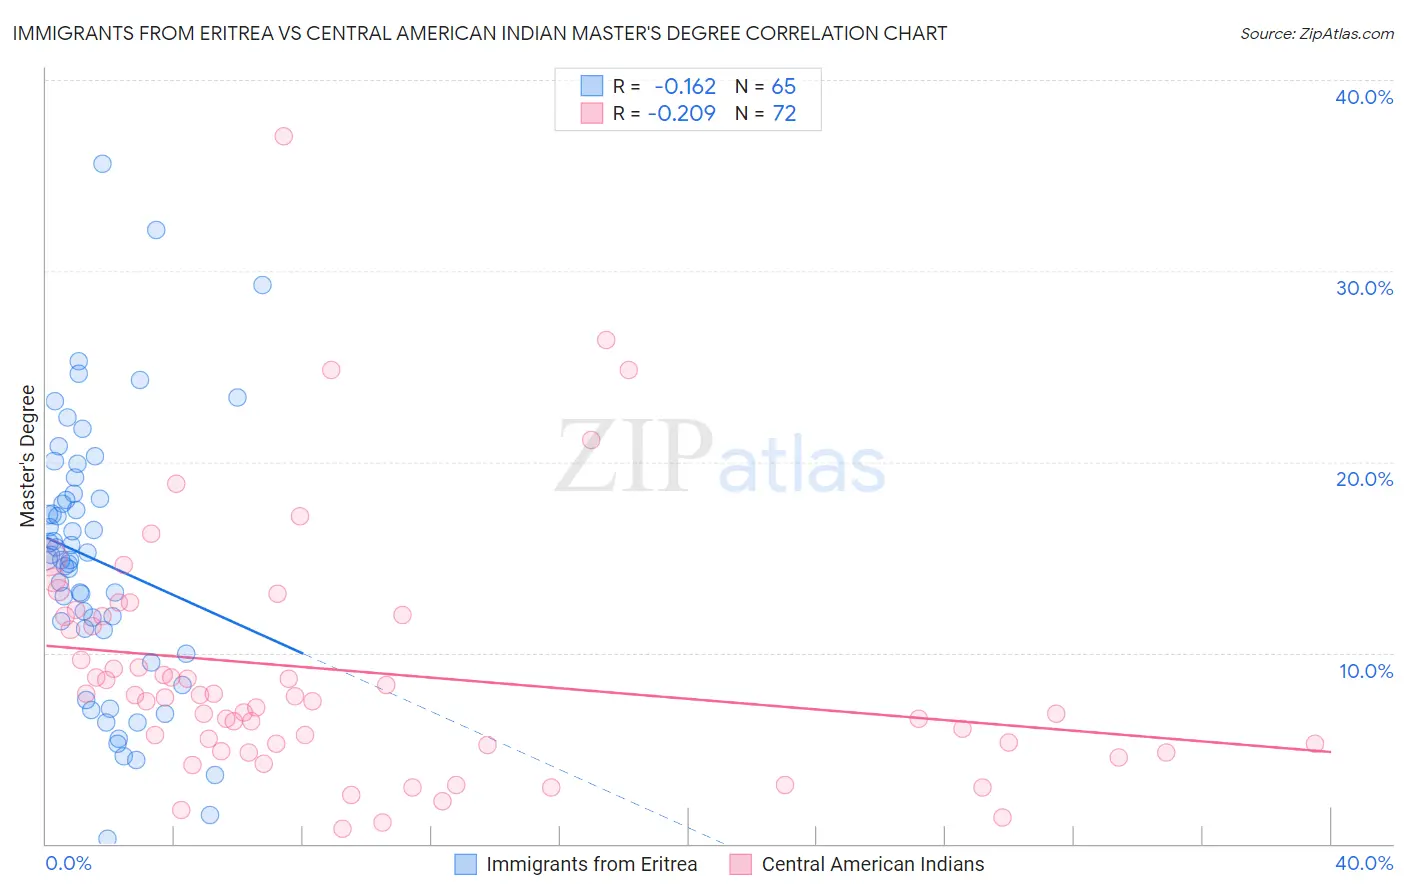
Immigrants from Eritrea vs Central American Indian Master's Degree Correlation Chart
The statistical analysis conducted on geographies consisting of 104,847,630 people shows a poor negative correlation between the proportion of Immigrants from Eritrea and percentage of population with at least master's degree education in the United States with a correlation coefficient (R) of -0.162 and weighted average of 16.4%. Similarly, the statistical analysis conducted on geographies consisting of 326,067,650 people shows a weak negative correlation between the proportion of Central American Indians and percentage of population with at least master's degree education in the United States with a correlation coefficient (R) of -0.209 and weighted average of 12.4%, a difference of 31.7%.
Master's Degree Correlation Summary
| Measurement | Immigrants from Eritrea | Central American Indian |
| Minimum | 0.25% | 0.78% |
| Maximum | 35.6% | 37.0% |
| Range | 35.4% | 36.3% |
| Mean | 14.8% | 9.1% |
| Median | 15.0% | 7.7% |
| Interquartile 25% (IQ1) | 10.6% | 5.2% |
| Interquartile 75% (IQ3) | 18.2% | 11.9% |
| Interquartile Range (IQR) | 7.6% | 6.7% |
| Standard Deviation (Sample) | 7.0% | 6.4% |
| Standard Deviation (Population) | 7.0% | 6.4% |
Similar Demographics by Master's Degree
Demographics Similar to Immigrants from Eritrea by Master's Degree
In terms of master's degree, the demographic groups most similar to Immigrants from Eritrea are Croatian (16.4%, a difference of 0.070%), Italian (16.4%, a difference of 0.070%), British (16.4%, a difference of 0.080%), Immigrants from Eastern Africa (16.3%, a difference of 0.19%), and Palestinian (16.3%, a difference of 0.45%).
| Demographics | Rating | Rank | Master's Degree |
| Immigrants | Moldova | 97.2 /100 | #117 | Exceptional 16.6% |
| Brazilians | 96.8 /100 | #118 | Exceptional 16.5% |
| Jordanians | 96.5 /100 | #119 | Exceptional 16.5% |
| Lebanese | 96.4 /100 | #120 | Exceptional 16.5% |
| Afghans | 96.2 /100 | #121 | Exceptional 16.5% |
| British | 95.6 /100 | #122 | Exceptional 16.4% |
| Croatians | 95.6 /100 | #123 | Exceptional 16.4% |
| Immigrants | Eritrea | 95.5 /100 | #124 | Exceptional 16.4% |
| Italians | 95.4 /100 | #125 | Exceptional 16.4% |
| Immigrants | Eastern Africa | 95.2 /100 | #126 | Exceptional 16.3% |
| Palestinians | 94.8 /100 | #127 | Exceptional 16.3% |
| Immigrants | Sierra Leone | 94.7 /100 | #128 | Exceptional 16.3% |
| Immigrants | Syria | 93.3 /100 | #129 | Exceptional 16.2% |
| Immigrants | Jordan | 92.7 /100 | #130 | Exceptional 16.1% |
| Taiwanese | 91.9 /100 | #131 | Exceptional 16.1% |
Demographics Similar to Central American Indians by Master's Degree
In terms of master's degree, the demographic groups most similar to Central American Indians are Belizean (12.4%, a difference of 0.17%), Immigrants from Fiji (12.4%, a difference of 0.19%), Nicaraguan (12.5%, a difference of 0.23%), Bahamian (12.4%, a difference of 0.34%), and Tongan (12.5%, a difference of 0.42%).
| Demographics | Rating | Rank | Master's Degree |
| Immigrants | Portugal | 0.8 /100 | #256 | Tragic 12.6% |
| Osage | 0.7 /100 | #257 | Tragic 12.6% |
| Immigrants | Liberia | 0.6 /100 | #258 | Tragic 12.5% |
| Japanese | 0.6 /100 | #259 | Tragic 12.5% |
| Dominicans | 0.6 /100 | #260 | Tragic 12.5% |
| Tongans | 0.6 /100 | #261 | Tragic 12.5% |
| Nicaraguans | 0.6 /100 | #262 | Tragic 12.5% |
| Central American Indians | 0.5 /100 | #263 | Tragic 12.4% |
| Belizeans | 0.5 /100 | #264 | Tragic 12.4% |
| Immigrants | Fiji | 0.5 /100 | #265 | Tragic 12.4% |
| Bahamians | 0.5 /100 | #266 | Tragic 12.4% |
| Americans | 0.4 /100 | #267 | Tragic 12.3% |
| Native Hawaiians | 0.4 /100 | #268 | Tragic 12.3% |
| Central Americans | 0.3 /100 | #269 | Tragic 12.2% |
| Salvadorans | 0.3 /100 | #270 | Tragic 12.2% |