Immigrants from Eritrea vs Zimbabwean In Labor Force | Age 35-44
COMPARE
Immigrants from Eritrea
Zimbabwean
In Labor Force | Age 35-44
In Labor Force | Age 35-44 Comparison
Immigrants from Eritrea
Zimbabweans
85.2%
IN LABOR FORCE | AGE 35-44
99.7/ 100
METRIC RATING
48th/ 347
METRIC RANK
86.1%
IN LABOR FORCE | AGE 35-44
100.0/ 100
METRIC RATING
5th/ 347
METRIC RANK
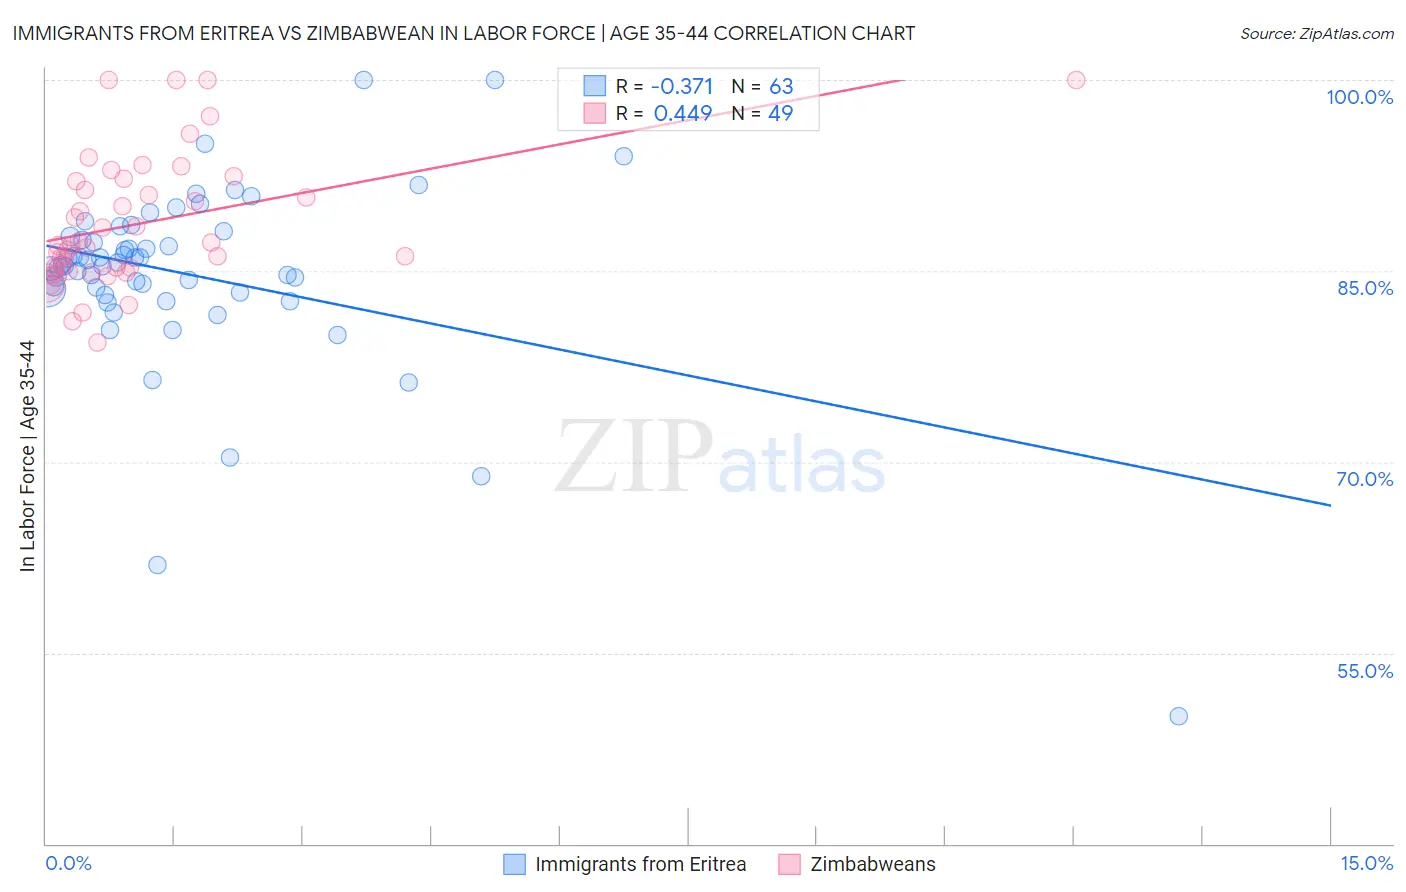
Immigrants from Eritrea vs Zimbabwean In Labor Force | Age 35-44 Correlation Chart
The statistical analysis conducted on geographies consisting of 104,844,448 people shows a mild negative correlation between the proportion of Immigrants from Eritrea and labor force participation rate among population between the ages 35 and 44 in the United States with a correlation coefficient (R) of -0.371 and weighted average of 85.2%. Similarly, the statistical analysis conducted on geographies consisting of 69,188,231 people shows a moderate positive correlation between the proportion of Zimbabweans and labor force participation rate among population between the ages 35 and 44 in the United States with a correlation coefficient (R) of 0.449 and weighted average of 86.1%, a difference of 1.1%.
In Labor Force | Age 35-44 Correlation Summary
| Measurement | Immigrants from Eritrea | Zimbabwean |
| Minimum | 50.0% | 79.4% |
| Maximum | 100.0% | 100.0% |
| Range | 50.0% | 20.6% |
| Mean | 84.7% | 88.7% |
| Median | 85.5% | 87.0% |
| Interquartile 25% (IQ1) | 83.3% | 85.1% |
| Interquartile 75% (IQ3) | 87.7% | 92.1% |
| Interquartile Range (IQR) | 4.4% | 7.0% |
| Standard Deviation (Sample) | 7.5% | 5.1% |
| Standard Deviation (Population) | 7.4% | 5.0% |
Similar Demographics by In Labor Force | Age 35-44
Demographics Similar to Immigrants from Eritrea by In Labor Force | Age 35-44
In terms of in labor force | age 35-44, the demographic groups most similar to Immigrants from Eritrea are Croatian (85.2%, a difference of 0.0%), German Russian (85.2%, a difference of 0.010%), Cypriot (85.2%, a difference of 0.020%), Immigrants from Hong Kong (85.2%, a difference of 0.020%), and Thai (85.2%, a difference of 0.030%).
| Demographics | Rating | Rank | In Labor Force | Age 35-44 |
| Immigrants | Zimbabwe | 99.8 /100 | #41 | Exceptional 85.2% |
| Macedonians | 99.8 /100 | #42 | Exceptional 85.2% |
| Poles | 99.8 /100 | #43 | Exceptional 85.2% |
| Lithuanians | 99.8 /100 | #44 | Exceptional 85.2% |
| Cypriots | 99.8 /100 | #45 | Exceptional 85.2% |
| Immigrants | Hong Kong | 99.8 /100 | #46 | Exceptional 85.2% |
| German Russians | 99.8 /100 | #47 | Exceptional 85.2% |
| Immigrants | Eritrea | 99.7 /100 | #48 | Exceptional 85.2% |
| Croatians | 99.7 /100 | #49 | Exceptional 85.2% |
| Thais | 99.7 /100 | #50 | Exceptional 85.2% |
| Immigrants | Albania | 99.7 /100 | #51 | Exceptional 85.1% |
| Immigrants | Kenya | 99.6 /100 | #52 | Exceptional 85.1% |
| Taiwanese | 99.6 /100 | #53 | Exceptional 85.1% |
| Turks | 99.5 /100 | #54 | Exceptional 85.1% |
| Soviet Union | 99.5 /100 | #55 | Exceptional 85.1% |
Demographics Similar to Zimbabweans by In Labor Force | Age 35-44
In terms of in labor force | age 35-44, the demographic groups most similar to Zimbabweans are Bolivian (86.1%, a difference of 0.010%), Immigrants from Sierra Leone (86.1%, a difference of 0.050%), Immigrants from Cabo Verde (86.2%, a difference of 0.13%), Immigrants from Bolivia (86.2%, a difference of 0.16%), and Immigrants from Ethiopia (85.9%, a difference of 0.22%).
| Demographics | Rating | Rank | In Labor Force | Age 35-44 |
| Sierra Leoneans | 100.0 /100 | #1 | Exceptional 86.4% |
| Luxembourgers | 100.0 /100 | #2 | Exceptional 86.4% |
| Immigrants | Bolivia | 100.0 /100 | #3 | Exceptional 86.2% |
| Immigrants | Cabo Verde | 100.0 /100 | #4 | Exceptional 86.2% |
| Zimbabweans | 100.0 /100 | #5 | Exceptional 86.1% |
| Bolivians | 100.0 /100 | #6 | Exceptional 86.1% |
| Immigrants | Sierra Leone | 100.0 /100 | #7 | Exceptional 86.1% |
| Immigrants | Ethiopia | 100.0 /100 | #8 | Exceptional 85.9% |
| Ethiopians | 100.0 /100 | #9 | Exceptional 85.9% |
| Cape Verdeans | 100.0 /100 | #10 | Exceptional 85.8% |
| Immigrants | Cameroon | 100.0 /100 | #11 | Exceptional 85.8% |
| Liberians | 100.0 /100 | #12 | Exceptional 85.7% |
| Somalis | 100.0 /100 | #13 | Exceptional 85.6% |
| Immigrants | Somalia | 100.0 /100 | #14 | Exceptional 85.6% |
| Norwegians | 100.0 /100 | #15 | Exceptional 85.6% |