Immigrants from Eritrea vs Zimbabwean 4th Grade
COMPARE
Immigrants from Eritrea
Zimbabwean
4th Grade
4th Grade Comparison
Immigrants from Eritrea
Zimbabweans
96.7%
4TH GRADE
0.0/ 100
METRIC RATING
294th/ 347
METRIC RANK
97.9%
4TH GRADE
98.8/ 100
METRIC RATING
87th/ 347
METRIC RANK
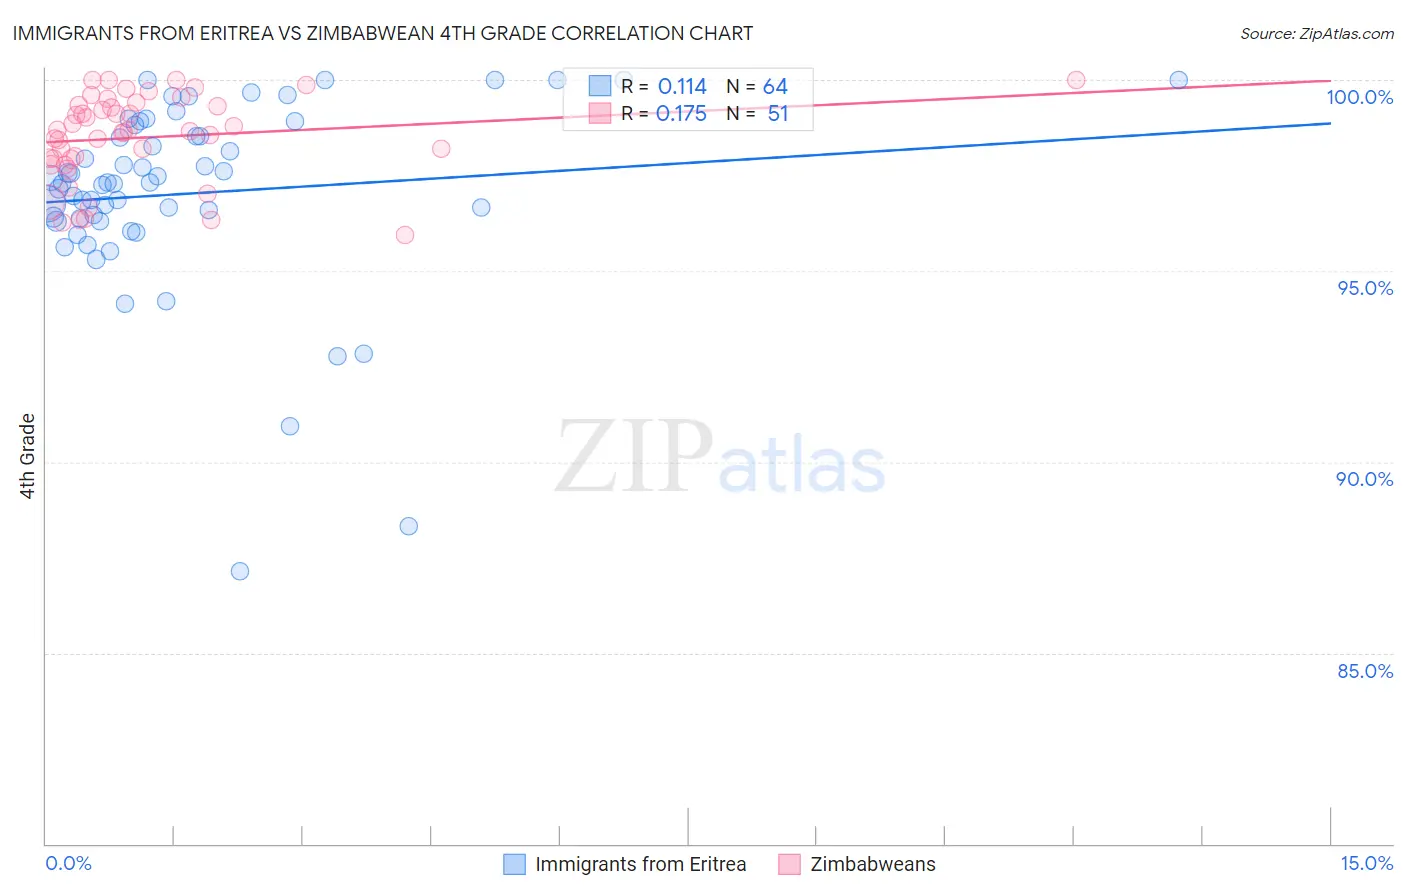
Immigrants from Eritrea vs Zimbabwean 4th Grade Correlation Chart
The statistical analysis conducted on geographies consisting of 104,791,429 people shows a poor positive correlation between the proportion of Immigrants from Eritrea and percentage of population with at least 4th grade education in the United States with a correlation coefficient (R) of 0.114 and weighted average of 96.7%. Similarly, the statistical analysis conducted on geographies consisting of 69,203,423 people shows a poor positive correlation between the proportion of Zimbabweans and percentage of population with at least 4th grade education in the United States with a correlation coefficient (R) of 0.175 and weighted average of 97.9%, a difference of 1.3%.
4th Grade Correlation Summary
| Measurement | Immigrants from Eritrea | Zimbabwean |
| Minimum | 87.1% | 95.9% |
| Maximum | 100.0% | 100.0% |
| Range | 12.9% | 4.1% |
| Mean | 97.0% | 98.5% |
| Median | 97.3% | 98.7% |
| Interquartile 25% (IQ1) | 96.3% | 97.9% |
| Interquartile 75% (IQ3) | 98.7% | 99.3% |
| Interquartile Range (IQR) | 2.3% | 1.4% |
| Standard Deviation (Sample) | 2.5% | 1.1% |
| Standard Deviation (Population) | 2.5% | 1.1% |
Similar Demographics by 4th Grade
Demographics Similar to Immigrants from Eritrea by 4th Grade
In terms of 4th grade, the demographic groups most similar to Immigrants from Eritrea are Puerto Rican (96.7%, a difference of 0.020%), Immigrants from Portugal (96.6%, a difference of 0.020%), Somali (96.6%, a difference of 0.030%), Malaysian (96.7%, a difference of 0.040%), and Immigrants from Grenada (96.7%, a difference of 0.050%).
| Demographics | Rating | Rank | 4th Grade |
| Houma | 0.0 /100 | #287 | Tragic 96.8% |
| Immigrants | Afghanistan | 0.0 /100 | #288 | Tragic 96.8% |
| Immigrants | West Indies | 0.0 /100 | #289 | Tragic 96.7% |
| British West Indians | 0.0 /100 | #290 | Tragic 96.7% |
| Immigrants | Grenada | 0.0 /100 | #291 | Tragic 96.7% |
| Malaysians | 0.0 /100 | #292 | Tragic 96.7% |
| Puerto Ricans | 0.0 /100 | #293 | Tragic 96.7% |
| Immigrants | Eritrea | 0.0 /100 | #294 | Tragic 96.7% |
| Immigrants | Portugal | 0.0 /100 | #295 | Tragic 96.6% |
| Somalis | 0.0 /100 | #296 | Tragic 96.6% |
| Immigrants | Somalia | 0.0 /100 | #297 | Tragic 96.5% |
| Haitians | 0.0 /100 | #298 | Tragic 96.5% |
| Immigrants | Dominica | 0.0 /100 | #299 | Tragic 96.5% |
| Immigrants | South Eastern Asia | 0.0 /100 | #300 | Tragic 96.5% |
| Immigrants | Immigrants | 0.0 /100 | #301 | Tragic 96.5% |
Demographics Similar to Zimbabweans by 4th Grade
In terms of 4th grade, the demographic groups most similar to Zimbabweans are Immigrants from Australia (97.9%, a difference of 0.0%), Immigrants from South Africa (97.9%, a difference of 0.0%), Delaware (97.9%, a difference of 0.0%), Immigrants from Denmark (97.9%, a difference of 0.0%), and Immigrants from Sweden (97.9%, a difference of 0.0%).
| Demographics | Rating | Rank | 4th Grade |
| Osage | 99.2 /100 | #80 | Exceptional 98.0% |
| Immigrants | India | 99.1 /100 | #81 | Exceptional 98.0% |
| Icelanders | 99.1 /100 | #82 | Exceptional 98.0% |
| Immigrants | Belgium | 99.0 /100 | #83 | Exceptional 97.9% |
| Cypriots | 98.9 /100 | #84 | Exceptional 97.9% |
| Potawatomi | 98.9 /100 | #85 | Exceptional 97.9% |
| Immigrants | Australia | 98.8 /100 | #86 | Exceptional 97.9% |
| Zimbabweans | 98.8 /100 | #87 | Exceptional 97.9% |
| Immigrants | South Africa | 98.8 /100 | #88 | Exceptional 97.9% |
| Delaware | 98.8 /100 | #89 | Exceptional 97.9% |
| Immigrants | Denmark | 98.7 /100 | #90 | Exceptional 97.9% |
| Immigrants | Sweden | 98.7 /100 | #91 | Exceptional 97.9% |
| Immigrants | Western Europe | 98.7 /100 | #92 | Exceptional 97.9% |
| Immigrants | Ireland | 98.7 /100 | #93 | Exceptional 97.9% |
| Shoshone | 98.7 /100 | #94 | Exceptional 97.9% |