Immigrants from Dominican Republic vs Zimbabwean Master's Degree
COMPARE
Immigrants from Dominican Republic
Zimbabwean
Master's Degree
Master's Degree Comparison
Immigrants from Dominican Republic
Zimbabweans
12.1%
MASTER'S DEGREE
0.2/ 100
METRIC RATING
280th/ 347
METRIC RANK
17.7%
MASTER'S DEGREE
99.7/ 100
METRIC RATING
73rd/ 347
METRIC RANK
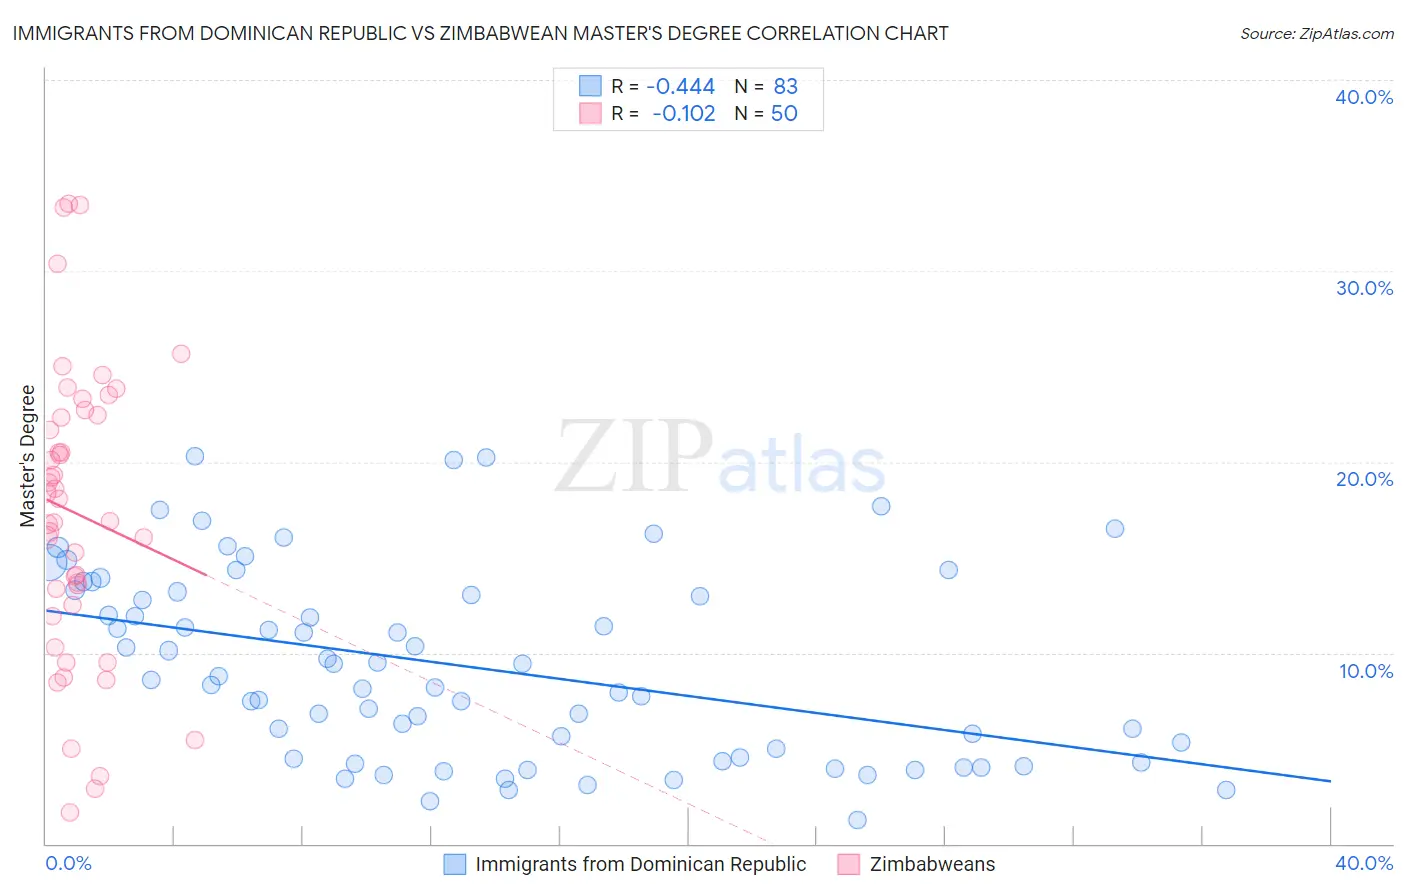
Immigrants from Dominican Republic vs Zimbabwean Master's Degree Correlation Chart
The statistical analysis conducted on geographies consisting of 275,069,954 people shows a moderate negative correlation between the proportion of Immigrants from Dominican Republic and percentage of population with at least master's degree education in the United States with a correlation coefficient (R) of -0.444 and weighted average of 12.1%. Similarly, the statistical analysis conducted on geographies consisting of 69,201,212 people shows a poor negative correlation between the proportion of Zimbabweans and percentage of population with at least master's degree education in the United States with a correlation coefficient (R) of -0.102 and weighted average of 17.7%, a difference of 47.1%.
Master's Degree Correlation Summary
| Measurement | Immigrants from Dominican Republic | Zimbabwean |
| Minimum | 1.2% | 1.7% |
| Maximum | 20.3% | 33.5% |
| Range | 19.1% | 31.8% |
| Mean | 9.3% | 17.3% |
| Median | 8.6% | 17.5% |
| Interquartile 25% (IQ1) | 4.4% | 12.5% |
| Interquartile 75% (IQ3) | 13.2% | 22.4% |
| Interquartile Range (IQR) | 8.7% | 9.9% |
| Standard Deviation (Sample) | 4.9% | 7.7% |
| Standard Deviation (Population) | 4.9% | 7.6% |
Similar Demographics by Master's Degree
Demographics Similar to Immigrants from Dominican Republic by Master's Degree
In terms of master's degree, the demographic groups most similar to Immigrants from Dominican Republic are Immigrants from Belize (12.1%, a difference of 0.060%), Malaysian (12.0%, a difference of 0.12%), Potawatomi (12.1%, a difference of 0.13%), Immigrants from Caribbean (12.1%, a difference of 0.14%), and Black/African American (12.1%, a difference of 0.15%).
| Demographics | Rating | Rank | Master's Degree |
| Blackfeet | 0.3 /100 | #273 | Tragic 12.1% |
| Cape Verdeans | 0.3 /100 | #274 | Tragic 12.1% |
| Cubans | 0.3 /100 | #275 | Tragic 12.1% |
| Blacks/African Americans | 0.3 /100 | #276 | Tragic 12.1% |
| Immigrants | Caribbean | 0.3 /100 | #277 | Tragic 12.1% |
| Potawatomi | 0.3 /100 | #278 | Tragic 12.1% |
| Immigrants | Belize | 0.2 /100 | #279 | Tragic 12.1% |
| Immigrants | Dominican Republic | 0.2 /100 | #280 | Tragic 12.1% |
| Malaysians | 0.2 /100 | #281 | Tragic 12.0% |
| Immigrants | El Salvador | 0.2 /100 | #282 | Tragic 12.0% |
| Hondurans | 0.2 /100 | #283 | Tragic 11.9% |
| Ottawa | 0.2 /100 | #284 | Tragic 11.9% |
| Immigrants | Nicaragua | 0.2 /100 | #285 | Tragic 11.8% |
| Aleuts | 0.1 /100 | #286 | Tragic 11.8% |
| Immigrants | Haiti | 0.1 /100 | #287 | Tragic 11.8% |
Demographics Similar to Zimbabweans by Master's Degree
In terms of master's degree, the demographic groups most similar to Zimbabweans are Lithuanian (17.7%, a difference of 0.11%), Immigrants from Pakistan (17.8%, a difference of 0.28%), Immigrants from Romania (17.7%, a difference of 0.31%), Immigrants from Western Europe (17.8%, a difference of 0.57%), and Egyptian (17.6%, a difference of 0.69%).
| Demographics | Rating | Rank | Master's Degree |
| Ethiopians | 99.8 /100 | #66 | Exceptional 18.0% |
| Immigrants | Argentina | 99.8 /100 | #67 | Exceptional 18.0% |
| Immigrants | Ethiopia | 99.8 /100 | #68 | Exceptional 17.9% |
| Immigrants | Uzbekistan | 99.8 /100 | #69 | Exceptional 17.9% |
| Immigrants | Western Europe | 99.8 /100 | #70 | Exceptional 17.8% |
| Immigrants | Pakistan | 99.7 /100 | #71 | Exceptional 17.8% |
| Lithuanians | 99.7 /100 | #72 | Exceptional 17.7% |
| Zimbabweans | 99.7 /100 | #73 | Exceptional 17.7% |
| Immigrants | Romania | 99.7 /100 | #74 | Exceptional 17.7% |
| Egyptians | 99.6 /100 | #75 | Exceptional 17.6% |
| Immigrants | Indonesia | 99.6 /100 | #76 | Exceptional 17.6% |
| Immigrants | Eastern Europe | 99.6 /100 | #77 | Exceptional 17.6% |
| Immigrants | Hungary | 99.6 /100 | #78 | Exceptional 17.5% |
| Immigrants | Lebanon | 99.6 /100 | #79 | Exceptional 17.5% |
| Carpatho Rusyns | 99.6 /100 | #80 | Exceptional 17.5% |