Immigrants from Eritrea vs Ecuadorian Master's Degree
COMPARE
Immigrants from Eritrea
Ecuadorian
Master's Degree
Master's Degree Comparison
Immigrants from Eritrea
Ecuadorians
16.4%
MASTER'S DEGREE
95.5/ 100
METRIC RATING
124th/ 347
METRIC RANK
14.0%
MASTER'S DEGREE
12.6/ 100
METRIC RATING
222nd/ 347
METRIC RANK
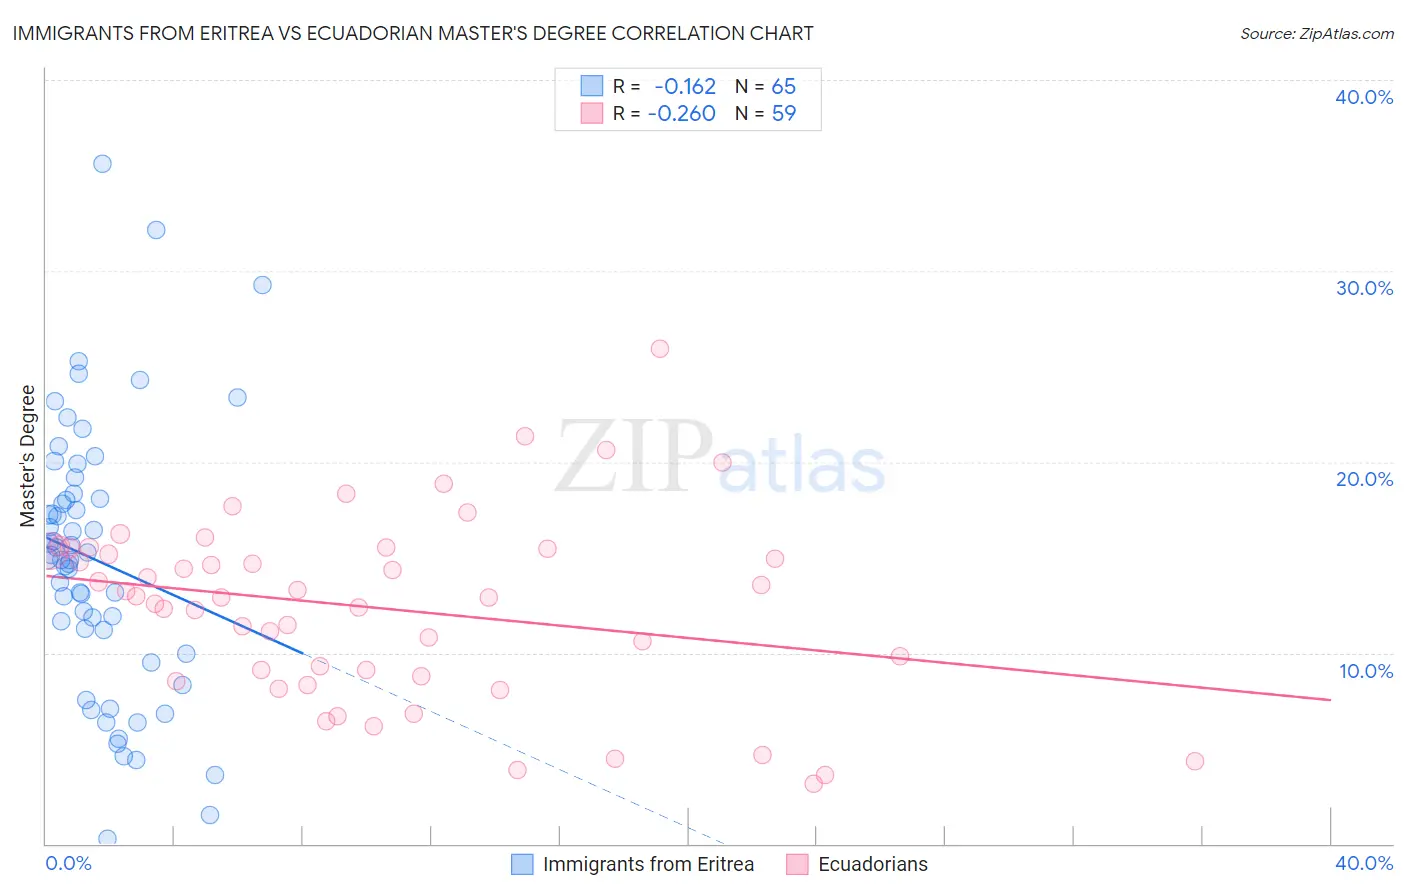
Immigrants from Eritrea vs Ecuadorian Master's Degree Correlation Chart
The statistical analysis conducted on geographies consisting of 104,847,630 people shows a poor negative correlation between the proportion of Immigrants from Eritrea and percentage of population with at least master's degree education in the United States with a correlation coefficient (R) of -0.162 and weighted average of 16.4%. Similarly, the statistical analysis conducted on geographies consisting of 317,754,376 people shows a weak negative correlation between the proportion of Ecuadorians and percentage of population with at least master's degree education in the United States with a correlation coefficient (R) of -0.260 and weighted average of 14.0%, a difference of 17.0%.
Master's Degree Correlation Summary
| Measurement | Immigrants from Eritrea | Ecuadorian |
| Minimum | 0.25% | 3.1% |
| Maximum | 35.6% | 25.9% |
| Range | 35.4% | 22.8% |
| Mean | 14.8% | 12.3% |
| Median | 15.0% | 12.9% |
| Interquartile 25% (IQ1) | 10.6% | 8.8% |
| Interquartile 75% (IQ3) | 18.2% | 15.5% |
| Interquartile Range (IQR) | 7.6% | 6.7% |
| Standard Deviation (Sample) | 7.0% | 4.8% |
| Standard Deviation (Population) | 7.0% | 4.8% |
Similar Demographics by Master's Degree
Demographics Similar to Immigrants from Eritrea by Master's Degree
In terms of master's degree, the demographic groups most similar to Immigrants from Eritrea are Croatian (16.4%, a difference of 0.070%), Italian (16.4%, a difference of 0.070%), British (16.4%, a difference of 0.080%), Immigrants from Eastern Africa (16.3%, a difference of 0.19%), and Palestinian (16.3%, a difference of 0.45%).
| Demographics | Rating | Rank | Master's Degree |
| Immigrants | Moldova | 97.2 /100 | #117 | Exceptional 16.6% |
| Brazilians | 96.8 /100 | #118 | Exceptional 16.5% |
| Jordanians | 96.5 /100 | #119 | Exceptional 16.5% |
| Lebanese | 96.4 /100 | #120 | Exceptional 16.5% |
| Afghans | 96.2 /100 | #121 | Exceptional 16.5% |
| British | 95.6 /100 | #122 | Exceptional 16.4% |
| Croatians | 95.6 /100 | #123 | Exceptional 16.4% |
| Immigrants | Eritrea | 95.5 /100 | #124 | Exceptional 16.4% |
| Italians | 95.4 /100 | #125 | Exceptional 16.4% |
| Immigrants | Eastern Africa | 95.2 /100 | #126 | Exceptional 16.3% |
| Palestinians | 94.8 /100 | #127 | Exceptional 16.3% |
| Immigrants | Sierra Leone | 94.7 /100 | #128 | Exceptional 16.3% |
| Immigrants | Syria | 93.3 /100 | #129 | Exceptional 16.2% |
| Immigrants | Jordan | 92.7 /100 | #130 | Exceptional 16.1% |
| Taiwanese | 91.9 /100 | #131 | Exceptional 16.1% |
Demographics Similar to Ecuadorians by Master's Degree
In terms of master's degree, the demographic groups most similar to Ecuadorians are Korean (14.0%, a difference of 0.030%), German (14.0%, a difference of 0.17%), Immigrants from South Eastern Asia (14.0%, a difference of 0.20%), Immigrants from Grenada (14.0%, a difference of 0.25%), and Norwegian (14.0%, a difference of 0.32%).
| Demographics | Rating | Rank | Master's Degree |
| Immigrants | Vietnam | 16.1 /100 | #215 | Poor 14.1% |
| Immigrants | Somalia | 15.8 /100 | #216 | Poor 14.1% |
| Immigrants | Trinidad and Tobago | 15.8 /100 | #217 | Poor 14.1% |
| French Canadians | 14.9 /100 | #218 | Poor 14.1% |
| Norwegians | 13.6 /100 | #219 | Poor 14.0% |
| Germans | 13.1 /100 | #220 | Poor 14.0% |
| Koreans | 12.7 /100 | #221 | Poor 14.0% |
| Ecuadorians | 12.6 /100 | #222 | Poor 14.0% |
| Immigrants | South Eastern Asia | 11.9 /100 | #223 | Poor 14.0% |
| Immigrants | Grenada | 11.8 /100 | #224 | Poor 14.0% |
| Portuguese | 11.2 /100 | #225 | Poor 13.9% |
| Immigrants | St. Vincent and the Grenadines | 11.0 /100 | #226 | Poor 13.9% |
| Immigrants | West Indies | 9.8 /100 | #227 | Tragic 13.9% |
| Whites/Caucasians | 9.1 /100 | #228 | Tragic 13.8% |
| British West Indians | 8.8 /100 | #229 | Tragic 13.8% |