Immigrants from Thailand vs Zimbabwean Master's Degree
COMPARE
Immigrants from Thailand
Zimbabwean
Master's Degree
Master's Degree Comparison
Immigrants from Thailand
Zimbabweans
14.2%
MASTER'S DEGREE
17.0/ 100
METRIC RATING
213th/ 347
METRIC RANK
17.7%
MASTER'S DEGREE
99.7/ 100
METRIC RATING
73rd/ 347
METRIC RANK
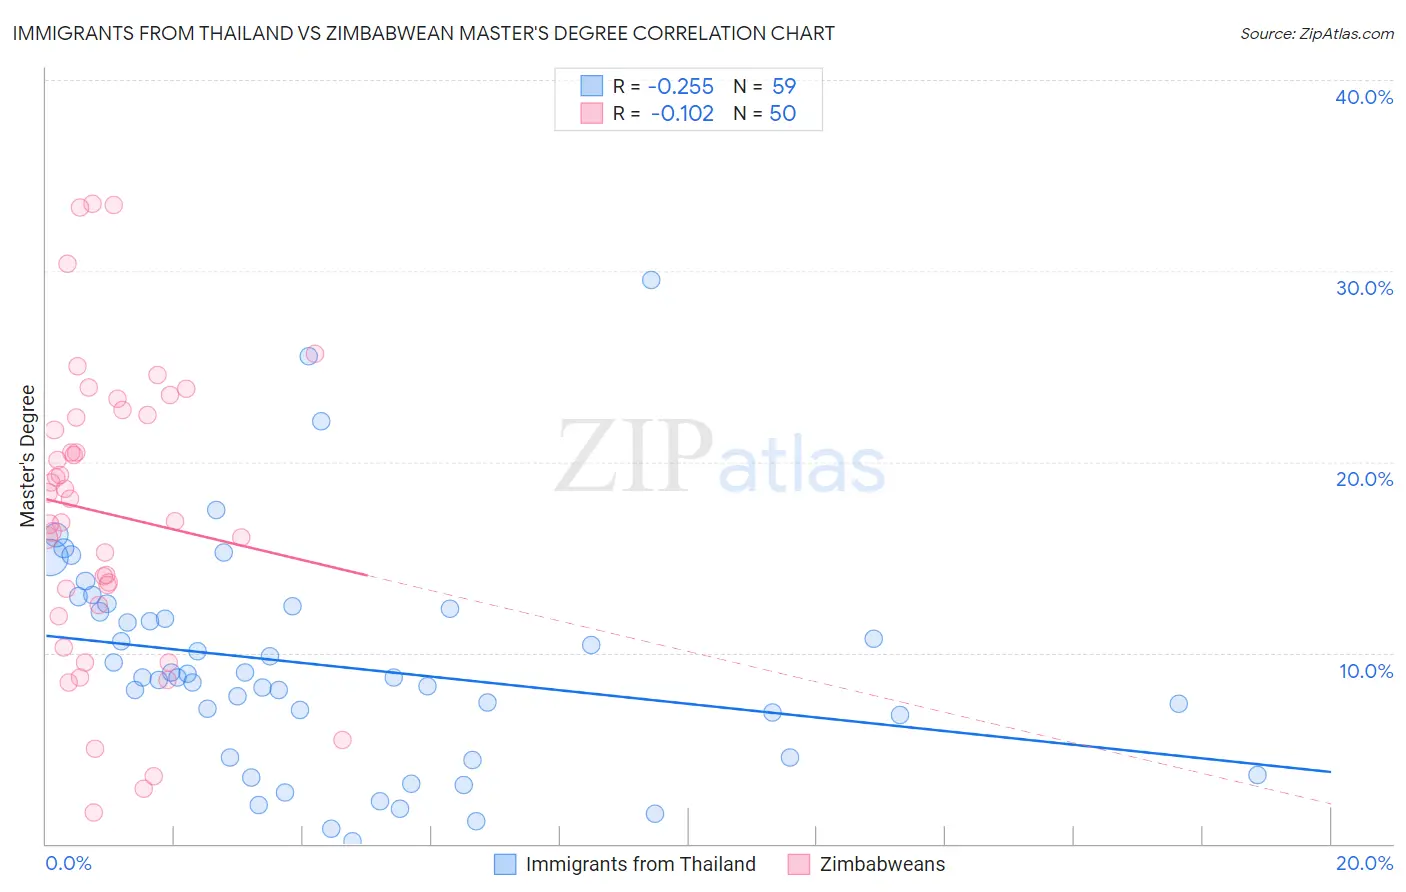
Immigrants from Thailand vs Zimbabwean Master's Degree Correlation Chart
The statistical analysis conducted on geographies consisting of 316,948,216 people shows a weak negative correlation between the proportion of Immigrants from Thailand and percentage of population with at least master's degree education in the United States with a correlation coefficient (R) of -0.255 and weighted average of 14.2%. Similarly, the statistical analysis conducted on geographies consisting of 69,201,212 people shows a poor negative correlation between the proportion of Zimbabweans and percentage of population with at least master's degree education in the United States with a correlation coefficient (R) of -0.102 and weighted average of 17.7%, a difference of 25.1%.
Master's Degree Correlation Summary
| Measurement | Immigrants from Thailand | Zimbabwean |
| Minimum | 0.16% | 1.7% |
| Maximum | 29.5% | 33.5% |
| Range | 29.4% | 31.8% |
| Mean | 9.3% | 17.3% |
| Median | 8.7% | 17.5% |
| Interquartile 25% (IQ1) | 4.5% | 12.5% |
| Interquartile 75% (IQ3) | 12.3% | 22.4% |
| Interquartile Range (IQR) | 7.8% | 9.9% |
| Standard Deviation (Sample) | 5.8% | 7.7% |
| Standard Deviation (Population) | 5.7% | 7.6% |
Similar Demographics by Master's Degree
Demographics Similar to Immigrants from Thailand by Master's Degree
In terms of master's degree, the demographic groups most similar to Immigrants from Thailand are Finnish (14.2%, a difference of 0.010%), Spanish (14.2%, a difference of 0.19%), Immigrants from Vietnam (14.1%, a difference of 0.22%), Somali (14.2%, a difference of 0.24%), and Immigrants from Somalia (14.1%, a difference of 0.29%).
| Demographics | Rating | Rank | Master's Degree |
| Scandinavians | 23.3 /100 | #206 | Fair 14.4% |
| Immigrants | Bosnia and Herzegovina | 22.0 /100 | #207 | Fair 14.3% |
| Immigrants | Barbados | 20.5 /100 | #208 | Fair 14.3% |
| Immigrants | Panama | 20.0 /100 | #209 | Fair 14.3% |
| Sub-Saharan Africans | 19.4 /100 | #210 | Poor 14.2% |
| Somalis | 18.0 /100 | #211 | Poor 14.2% |
| Spanish | 17.8 /100 | #212 | Poor 14.2% |
| Immigrants | Thailand | 17.0 /100 | #213 | Poor 14.2% |
| Finns | 16.9 /100 | #214 | Poor 14.2% |
| Immigrants | Vietnam | 16.1 /100 | #215 | Poor 14.1% |
| Immigrants | Somalia | 15.8 /100 | #216 | Poor 14.1% |
| Immigrants | Trinidad and Tobago | 15.8 /100 | #217 | Poor 14.1% |
| French Canadians | 14.9 /100 | #218 | Poor 14.1% |
| Norwegians | 13.6 /100 | #219 | Poor 14.0% |
| Germans | 13.1 /100 | #220 | Poor 14.0% |
Demographics Similar to Zimbabweans by Master's Degree
In terms of master's degree, the demographic groups most similar to Zimbabweans are Lithuanian (17.7%, a difference of 0.11%), Immigrants from Pakistan (17.8%, a difference of 0.28%), Immigrants from Romania (17.7%, a difference of 0.31%), Immigrants from Western Europe (17.8%, a difference of 0.57%), and Egyptian (17.6%, a difference of 0.69%).
| Demographics | Rating | Rank | Master's Degree |
| Ethiopians | 99.8 /100 | #66 | Exceptional 18.0% |
| Immigrants | Argentina | 99.8 /100 | #67 | Exceptional 18.0% |
| Immigrants | Ethiopia | 99.8 /100 | #68 | Exceptional 17.9% |
| Immigrants | Uzbekistan | 99.8 /100 | #69 | Exceptional 17.9% |
| Immigrants | Western Europe | 99.8 /100 | #70 | Exceptional 17.8% |
| Immigrants | Pakistan | 99.7 /100 | #71 | Exceptional 17.8% |
| Lithuanians | 99.7 /100 | #72 | Exceptional 17.7% |
| Zimbabweans | 99.7 /100 | #73 | Exceptional 17.7% |
| Immigrants | Romania | 99.7 /100 | #74 | Exceptional 17.7% |
| Egyptians | 99.6 /100 | #75 | Exceptional 17.6% |
| Immigrants | Indonesia | 99.6 /100 | #76 | Exceptional 17.6% |
| Immigrants | Eastern Europe | 99.6 /100 | #77 | Exceptional 17.6% |
| Immigrants | Hungary | 99.6 /100 | #78 | Exceptional 17.5% |
| Immigrants | Lebanon | 99.6 /100 | #79 | Exceptional 17.5% |
| Carpatho Rusyns | 99.6 /100 | #80 | Exceptional 17.5% |