Immigrants from Ireland vs Zimbabwean Master's Degree
COMPARE
Immigrants from Ireland
Zimbabwean
Master's Degree
Master's Degree Comparison
Immigrants from Ireland
Zimbabweans
20.4%
MASTER'S DEGREE
100.0/ 100
METRIC RATING
21st/ 347
METRIC RANK
17.7%
MASTER'S DEGREE
99.7/ 100
METRIC RATING
73rd/ 347
METRIC RANK
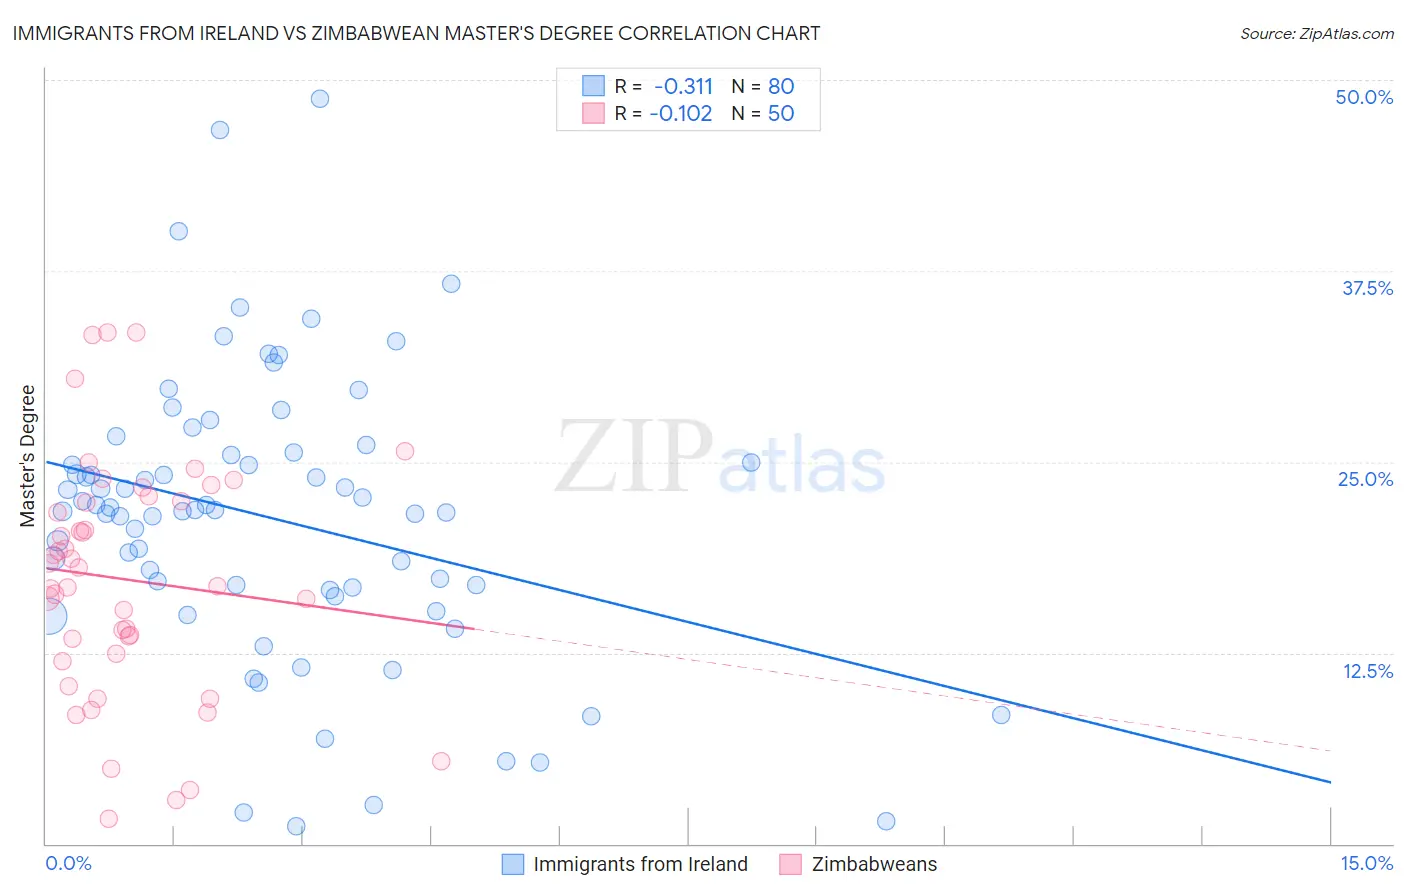
Immigrants from Ireland vs Zimbabwean Master's Degree Correlation Chart
The statistical analysis conducted on geographies consisting of 240,764,624 people shows a mild negative correlation between the proportion of Immigrants from Ireland and percentage of population with at least master's degree education in the United States with a correlation coefficient (R) of -0.311 and weighted average of 20.4%. Similarly, the statistical analysis conducted on geographies consisting of 69,201,212 people shows a poor negative correlation between the proportion of Zimbabweans and percentage of population with at least master's degree education in the United States with a correlation coefficient (R) of -0.102 and weighted average of 17.7%, a difference of 15.3%.
Master's Degree Correlation Summary
| Measurement | Immigrants from Ireland | Zimbabwean |
| Minimum | 1.1% | 1.7% |
| Maximum | 48.7% | 33.5% |
| Range | 47.6% | 31.8% |
| Mean | 21.3% | 17.3% |
| Median | 21.8% | 17.5% |
| Interquartile 25% (IQ1) | 16.7% | 12.5% |
| Interquartile 75% (IQ3) | 25.5% | 22.4% |
| Interquartile Range (IQR) | 8.8% | 9.9% |
| Standard Deviation (Sample) | 9.3% | 7.7% |
| Standard Deviation (Population) | 9.3% | 7.6% |
Similar Demographics by Master's Degree
Demographics Similar to Immigrants from Ireland by Master's Degree
In terms of master's degree, the demographic groups most similar to Immigrants from Ireland are Indian (Asian) (20.5%, a difference of 0.11%), Immigrants from Hong Kong (20.5%, a difference of 0.13%), Israeli (20.3%, a difference of 0.42%), Soviet Union (20.5%, a difference of 0.48%), and Immigrants from France (20.3%, a difference of 0.70%).
| Demographics | Rating | Rank | Master's Degree |
| Immigrants | Switzerland | 100.0 /100 | #14 | Exceptional 20.9% |
| Immigrants | Eastern Asia | 100.0 /100 | #15 | Exceptional 20.8% |
| Immigrants | Belgium | 100.0 /100 | #16 | Exceptional 20.8% |
| Immigrants | South Central Asia | 100.0 /100 | #17 | Exceptional 20.7% |
| Soviet Union | 100.0 /100 | #18 | Exceptional 20.5% |
| Immigrants | Hong Kong | 100.0 /100 | #19 | Exceptional 20.5% |
| Indians (Asian) | 100.0 /100 | #20 | Exceptional 20.5% |
| Immigrants | Ireland | 100.0 /100 | #21 | Exceptional 20.4% |
| Israelis | 100.0 /100 | #22 | Exceptional 20.3% |
| Immigrants | France | 100.0 /100 | #23 | Exceptional 20.3% |
| Immigrants | Sweden | 100.0 /100 | #24 | Exceptional 20.3% |
| Immigrants | Japan | 100.0 /100 | #25 | Exceptional 20.0% |
| Cambodians | 100.0 /100 | #26 | Exceptional 20.0% |
| Immigrants | Sri Lanka | 100.0 /100 | #27 | Exceptional 19.9% |
| Turks | 100.0 /100 | #28 | Exceptional 19.9% |
Demographics Similar to Zimbabweans by Master's Degree
In terms of master's degree, the demographic groups most similar to Zimbabweans are Lithuanian (17.7%, a difference of 0.11%), Immigrants from Pakistan (17.8%, a difference of 0.28%), Immigrants from Romania (17.7%, a difference of 0.31%), Immigrants from Western Europe (17.8%, a difference of 0.57%), and Egyptian (17.6%, a difference of 0.69%).
| Demographics | Rating | Rank | Master's Degree |
| Ethiopians | 99.8 /100 | #66 | Exceptional 18.0% |
| Immigrants | Argentina | 99.8 /100 | #67 | Exceptional 18.0% |
| Immigrants | Ethiopia | 99.8 /100 | #68 | Exceptional 17.9% |
| Immigrants | Uzbekistan | 99.8 /100 | #69 | Exceptional 17.9% |
| Immigrants | Western Europe | 99.8 /100 | #70 | Exceptional 17.8% |
| Immigrants | Pakistan | 99.7 /100 | #71 | Exceptional 17.8% |
| Lithuanians | 99.7 /100 | #72 | Exceptional 17.7% |
| Zimbabweans | 99.7 /100 | #73 | Exceptional 17.7% |
| Immigrants | Romania | 99.7 /100 | #74 | Exceptional 17.7% |
| Egyptians | 99.6 /100 | #75 | Exceptional 17.6% |
| Immigrants | Indonesia | 99.6 /100 | #76 | Exceptional 17.6% |
| Immigrants | Eastern Europe | 99.6 /100 | #77 | Exceptional 17.6% |
| Immigrants | Hungary | 99.6 /100 | #78 | Exceptional 17.5% |
| Immigrants | Lebanon | 99.6 /100 | #79 | Exceptional 17.5% |
| Carpatho Rusyns | 99.6 /100 | #80 | Exceptional 17.5% |