Immigrants from Eritrea vs Immigrants from Syria College, Under 1 year
COMPARE
Immigrants from Eritrea
Immigrants from Syria
College, Under 1 year
College, Under 1 year Comparison
Immigrants from Eritrea
Immigrants from Syria
66.1%
COLLEGE, UNDER 1 YEAR
71.9/ 100
METRIC RATING
154th/ 347
METRIC RANK
66.9%
COLLEGE, UNDER 1 YEAR
89.0/ 100
METRIC RATING
130th/ 347
METRIC RANK
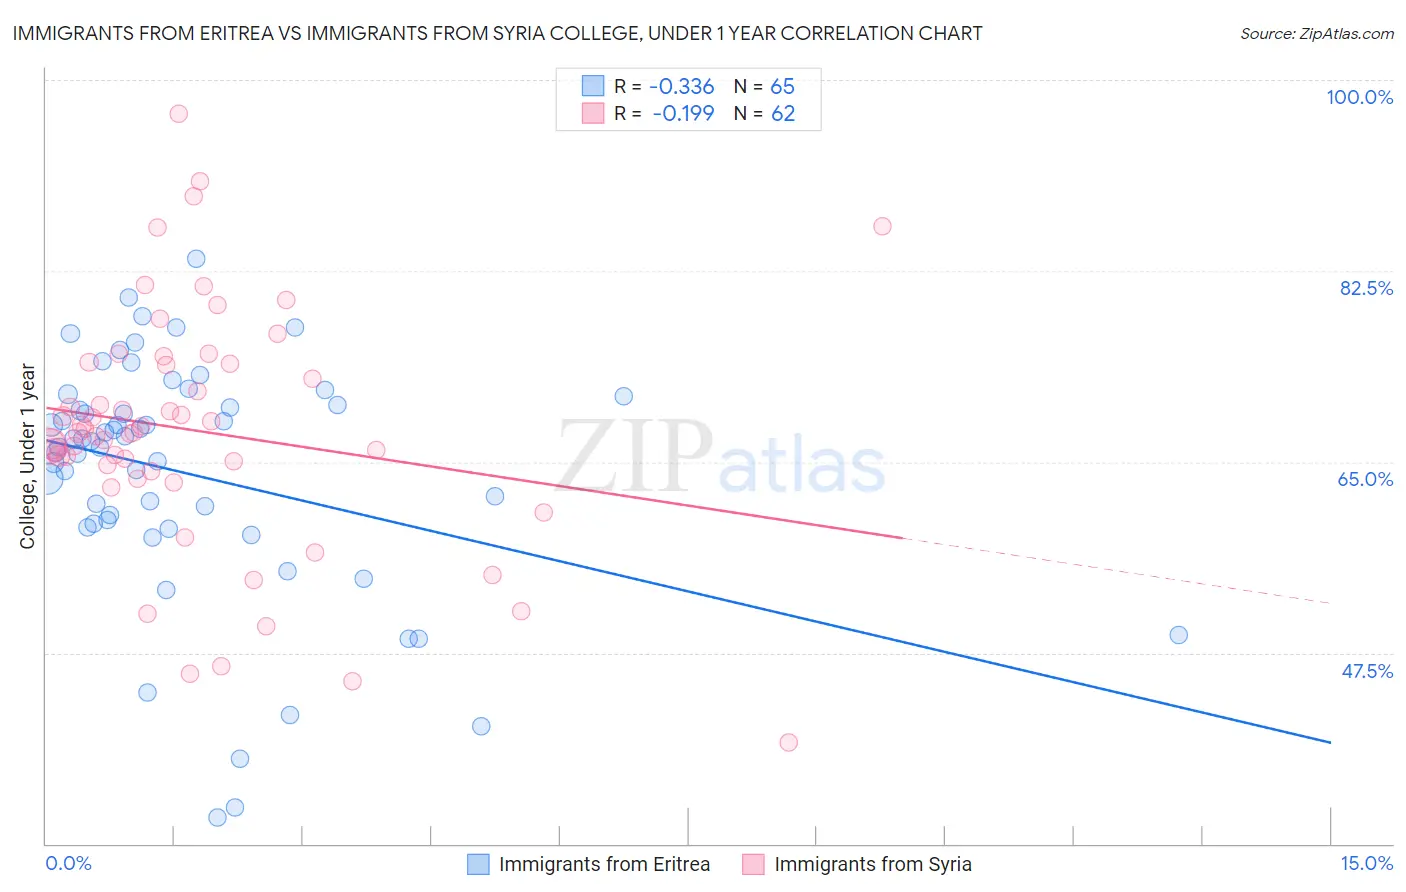
Immigrants from Eritrea vs Immigrants from Syria College, Under 1 year Correlation Chart
The statistical analysis conducted on geographies consisting of 104,852,201 people shows a mild negative correlation between the proportion of Immigrants from Eritrea and percentage of population with at least college, under 1 year education in the United States with a correlation coefficient (R) of -0.336 and weighted average of 66.1%. Similarly, the statistical analysis conducted on geographies consisting of 174,109,130 people shows a poor negative correlation between the proportion of Immigrants from Syria and percentage of population with at least college, under 1 year education in the United States with a correlation coefficient (R) of -0.199 and weighted average of 66.9%, a difference of 1.3%.
College, Under 1 year Correlation Summary
| Measurement | Immigrants from Eritrea | Immigrants from Syria |
| Minimum | 32.4% | 39.2% |
| Maximum | 83.6% | 96.9% |
| Range | 51.2% | 57.7% |
| Mean | 63.9% | 67.8% |
| Median | 66.9% | 67.7% |
| Interquartile 25% (IQ1) | 59.2% | 64.1% |
| Interquartile 75% (IQ3) | 70.6% | 74.0% |
| Interquartile Range (IQR) | 11.4% | 9.9% |
| Standard Deviation (Sample) | 11.1% | 11.2% |
| Standard Deviation (Population) | 11.0% | 11.1% |
Similar Demographics by College, Under 1 year
Demographics Similar to Immigrants from Eritrea by College, Under 1 year
In terms of college, under 1 year, the demographic groups most similar to Immigrants from Eritrea are Irish (66.0%, a difference of 0.090%), Belgian (66.2%, a difference of 0.10%), Welsh (66.0%, a difference of 0.11%), Sudanese (66.2%, a difference of 0.12%), and Sierra Leonean (66.0%, a difference of 0.21%).
| Demographics | Rating | Rank | College, Under 1 year |
| Immigrants | Morocco | 81.7 /100 | #147 | Excellent 66.5% |
| Taiwanese | 78.6 /100 | #148 | Good 66.4% |
| Immigrants | Venezuela | 77.9 /100 | #149 | Good 66.3% |
| Immigrants | Iraq | 77.1 /100 | #150 | Good 66.3% |
| Immigrants | Sudan | 76.0 /100 | #151 | Good 66.2% |
| Sudanese | 74.1 /100 | #152 | Good 66.2% |
| Belgians | 73.7 /100 | #153 | Good 66.2% |
| Immigrants | Eritrea | 71.9 /100 | #154 | Good 66.1% |
| Irish | 70.3 /100 | #155 | Good 66.0% |
| Welsh | 69.9 /100 | #156 | Good 66.0% |
| Sierra Leoneans | 67.8 /100 | #157 | Good 66.0% |
| Celtics | 67.3 /100 | #158 | Good 65.9% |
| Tlingit-Haida | 66.4 /100 | #159 | Good 65.9% |
| Albanians | 66.1 /100 | #160 | Good 65.9% |
| Brazilians | 66.0 /100 | #161 | Good 65.9% |
Demographics Similar to Immigrants from Syria by College, Under 1 year
In terms of college, under 1 year, the demographic groups most similar to Immigrants from Syria are Finnish (66.9%, a difference of 0.040%), Immigrants from Eastern Africa (67.0%, a difference of 0.060%), Polish (66.9%, a difference of 0.060%), Immigrants from Brazil (66.9%, a difference of 0.070%), and Iraqi (66.8%, a difference of 0.11%).
| Demographics | Rating | Rank | College, Under 1 year |
| Immigrants | Northern Africa | 92.7 /100 | #123 | Exceptional 67.2% |
| Arabs | 92.6 /100 | #124 | Exceptional 67.2% |
| Italians | 91.8 /100 | #125 | Exceptional 67.2% |
| Alsatians | 91.3 /100 | #126 | Exceptional 67.1% |
| Czechs | 90.8 /100 | #127 | Exceptional 67.1% |
| Scottish | 90.2 /100 | #128 | Exceptional 67.0% |
| Immigrants | Eastern Africa | 89.5 /100 | #129 | Excellent 67.0% |
| Immigrants | Syria | 89.0 /100 | #130 | Excellent 66.9% |
| Finns | 88.6 /100 | #131 | Excellent 66.9% |
| Poles | 88.4 /100 | #132 | Excellent 66.9% |
| Immigrants | Brazil | 88.3 /100 | #133 | Excellent 66.9% |
| Iraqis | 88.0 /100 | #134 | Excellent 66.8% |
| Canadians | 87.9 /100 | #135 | Excellent 66.8% |
| Ugandans | 87.8 /100 | #136 | Excellent 66.8% |
| Immigrants | Chile | 87.4 /100 | #137 | Excellent 66.8% |