Immigrants from Eritrea vs French College, Under 1 year
COMPARE
Immigrants from Eritrea
French
College, Under 1 year
College, Under 1 year Comparison
Immigrants from Eritrea
French
66.1%
COLLEGE, UNDER 1 YEAR
71.9/ 100
METRIC RATING
154th/ 347
METRIC RANK
65.4%
COLLEGE, UNDER 1 YEAR
48.9/ 100
METRIC RATING
176th/ 347
METRIC RANK
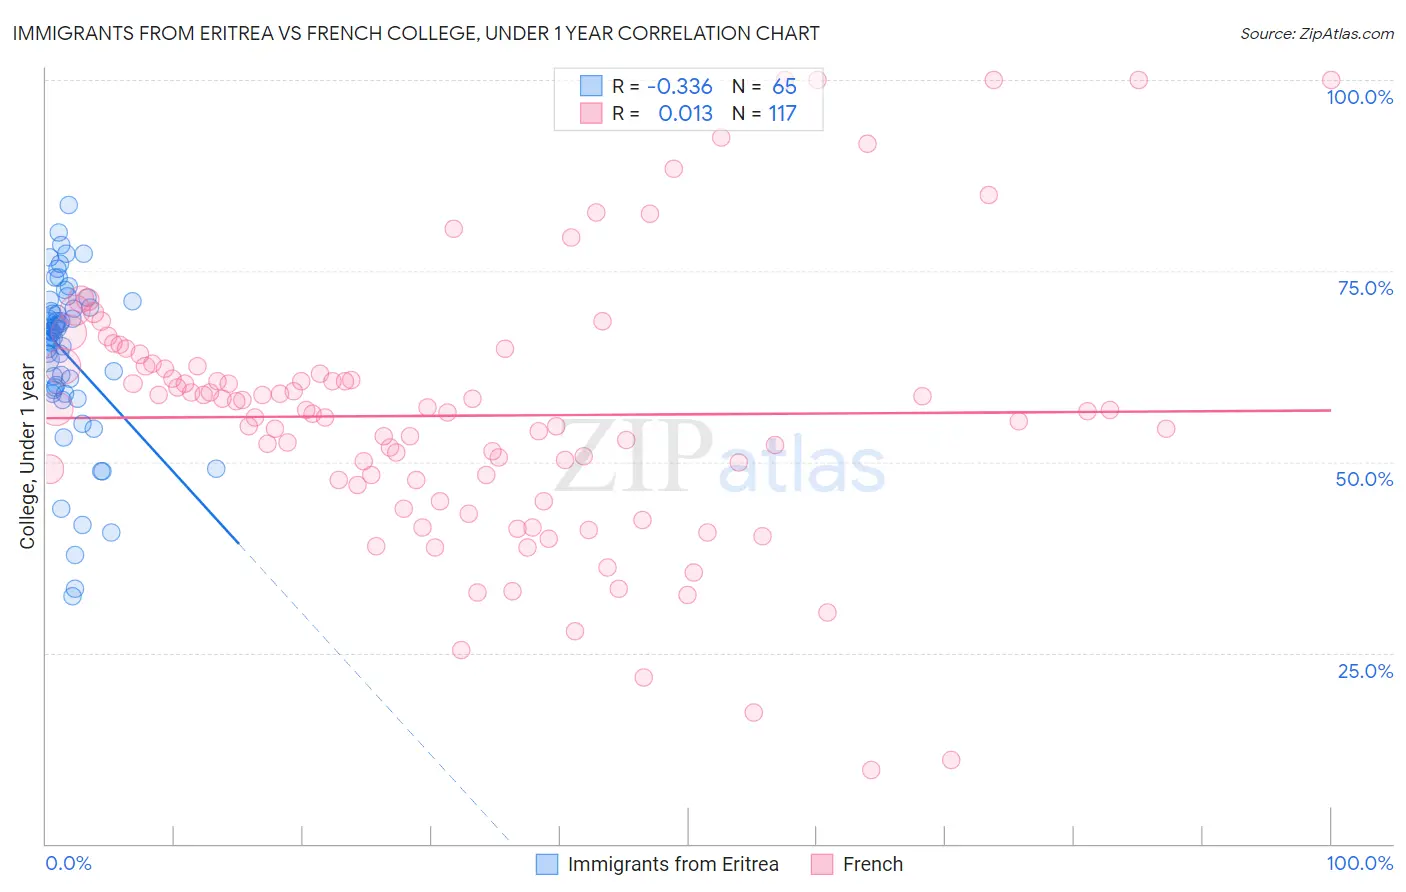
Immigrants from Eritrea vs French College, Under 1 year Correlation Chart
The statistical analysis conducted on geographies consisting of 104,852,201 people shows a mild negative correlation between the proportion of Immigrants from Eritrea and percentage of population with at least college, under 1 year education in the United States with a correlation coefficient (R) of -0.336 and weighted average of 66.1%. Similarly, the statistical analysis conducted on geographies consisting of 572,421,554 people shows no correlation between the proportion of French and percentage of population with at least college, under 1 year education in the United States with a correlation coefficient (R) of 0.013 and weighted average of 65.4%, a difference of 1.1%.
College, Under 1 year Correlation Summary
| Measurement | Immigrants from Eritrea | French |
| Minimum | 32.4% | 9.7% |
| Maximum | 83.6% | 100.0% |
| Range | 51.2% | 90.3% |
| Mean | 63.9% | 56.0% |
| Median | 66.9% | 56.6% |
| Interquartile 25% (IQ1) | 59.2% | 47.3% |
| Interquartile 75% (IQ3) | 70.6% | 62.5% |
| Interquartile Range (IQR) | 11.4% | 15.2% |
| Standard Deviation (Sample) | 11.1% | 17.4% |
| Standard Deviation (Population) | 11.0% | 17.3% |
Similar Demographics by College, Under 1 year
Demographics Similar to Immigrants from Eritrea by College, Under 1 year
In terms of college, under 1 year, the demographic groups most similar to Immigrants from Eritrea are Irish (66.0%, a difference of 0.090%), Belgian (66.2%, a difference of 0.10%), Welsh (66.0%, a difference of 0.11%), Sudanese (66.2%, a difference of 0.12%), and Sierra Leonean (66.0%, a difference of 0.21%).
| Demographics | Rating | Rank | College, Under 1 year |
| Immigrants | Morocco | 81.7 /100 | #147 | Excellent 66.5% |
| Taiwanese | 78.6 /100 | #148 | Good 66.4% |
| Immigrants | Venezuela | 77.9 /100 | #149 | Good 66.3% |
| Immigrants | Iraq | 77.1 /100 | #150 | Good 66.3% |
| Immigrants | Sudan | 76.0 /100 | #151 | Good 66.2% |
| Sudanese | 74.1 /100 | #152 | Good 66.2% |
| Belgians | 73.7 /100 | #153 | Good 66.2% |
| Immigrants | Eritrea | 71.9 /100 | #154 | Good 66.1% |
| Irish | 70.3 /100 | #155 | Good 66.0% |
| Welsh | 69.9 /100 | #156 | Good 66.0% |
| Sierra Leoneans | 67.8 /100 | #157 | Good 66.0% |
| Celtics | 67.3 /100 | #158 | Good 65.9% |
| Tlingit-Haida | 66.4 /100 | #159 | Good 65.9% |
| Albanians | 66.1 /100 | #160 | Good 65.9% |
| Brazilians | 66.0 /100 | #161 | Good 65.9% |
Demographics Similar to French by College, Under 1 year
In terms of college, under 1 year, the demographic groups most similar to French are Immigrants from North Macedonia (65.4%, a difference of 0.010%), Scotch-Irish (65.4%, a difference of 0.030%), German Russian (65.4%, a difference of 0.030%), Guamanian/Chamorro (65.4%, a difference of 0.030%), and Immigrants from Bosnia and Herzegovina (65.4%, a difference of 0.050%).
| Demographics | Rating | Rank | College, Under 1 year |
| Yugoslavians | 55.7 /100 | #169 | Average 65.6% |
| Germans | 55.7 /100 | #170 | Average 65.6% |
| Immigrants | Oceania | 55.0 /100 | #171 | Average 65.6% |
| South American Indians | 54.4 /100 | #172 | Average 65.5% |
| Swiss | 53.9 /100 | #173 | Average 65.5% |
| Immigrants | Bosnia and Herzegovina | 50.0 /100 | #174 | Average 65.4% |
| Scotch-Irish | 49.5 /100 | #175 | Average 65.4% |
| French | 48.9 /100 | #176 | Average 65.4% |
| Immigrants | North Macedonia | 48.6 /100 | #177 | Average 65.4% |
| German Russians | 48.3 /100 | #178 | Average 65.4% |
| Guamanians/Chamorros | 48.2 /100 | #179 | Average 65.4% |
| Dutch | 46.1 /100 | #180 | Average 65.3% |
| Spaniards | 45.5 /100 | #181 | Average 65.3% |
| Immigrants | Africa | 44.7 /100 | #182 | Average 65.3% |
| Immigrants | Poland | 42.6 /100 | #183 | Average 65.2% |