Icelander vs Immigrants from Syria College, Under 1 year
COMPARE
Icelander
Immigrants from Syria
College, Under 1 year
College, Under 1 year Comparison
Icelanders
Immigrants from Syria
68.3%
COLLEGE, UNDER 1 YEAR
98.1/ 100
METRIC RATING
90th/ 347
METRIC RANK
66.9%
COLLEGE, UNDER 1 YEAR
89.0/ 100
METRIC RATING
130th/ 347
METRIC RANK
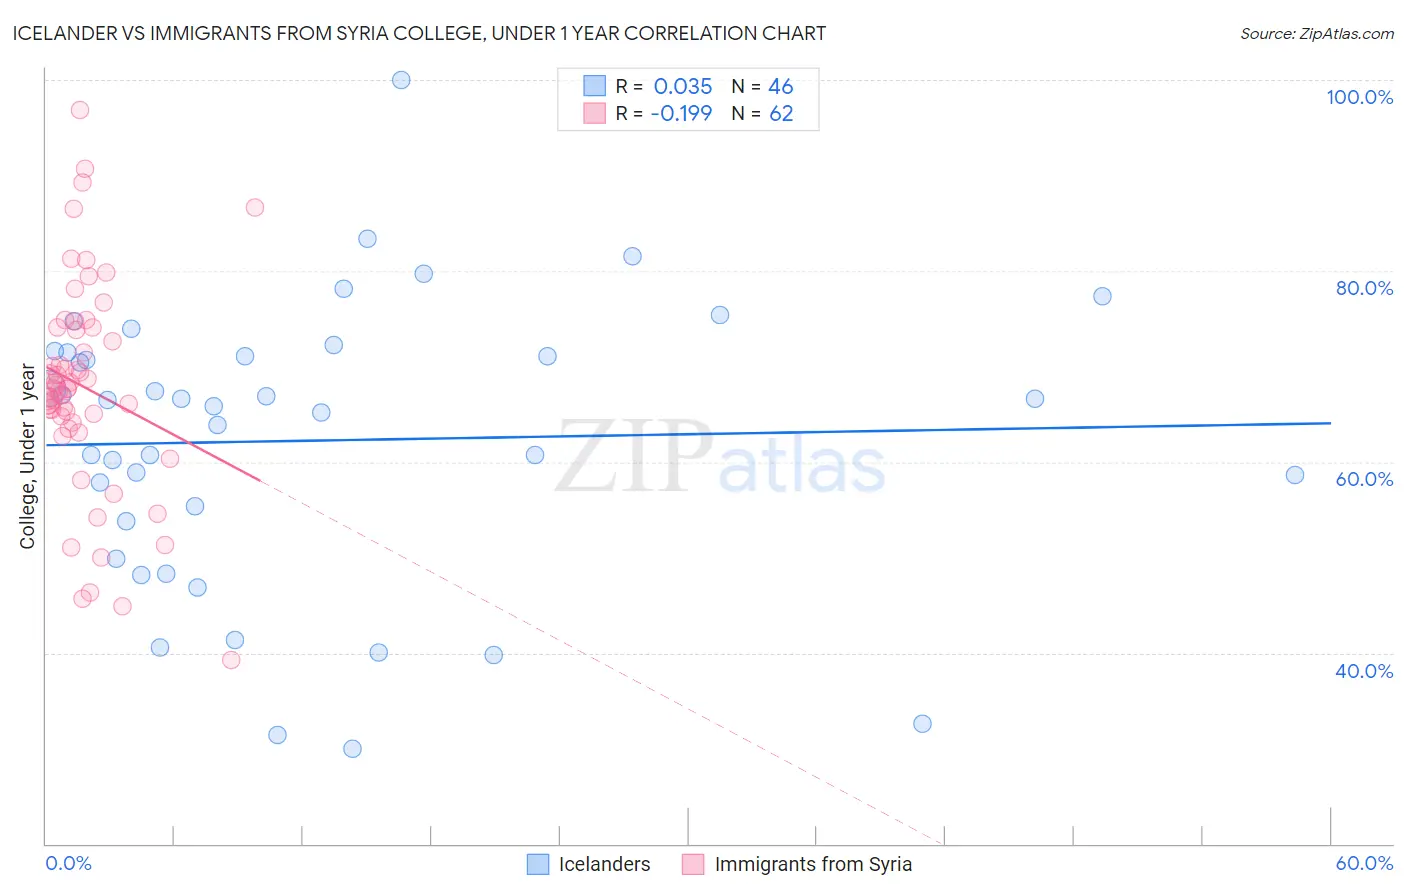
Icelander vs Immigrants from Syria College, Under 1 year Correlation Chart
The statistical analysis conducted on geographies consisting of 159,668,975 people shows no correlation between the proportion of Icelanders and percentage of population with at least college, under 1 year education in the United States with a correlation coefficient (R) of 0.035 and weighted average of 68.3%. Similarly, the statistical analysis conducted on geographies consisting of 174,109,130 people shows a poor negative correlation between the proportion of Immigrants from Syria and percentage of population with at least college, under 1 year education in the United States with a correlation coefficient (R) of -0.199 and weighted average of 66.9%, a difference of 2.0%.
College, Under 1 year Correlation Summary
| Measurement | Icelander | Immigrants from Syria |
| Minimum | 30.0% | 39.2% |
| Maximum | 100.0% | 96.9% |
| Range | 70.0% | 57.7% |
| Mean | 62.2% | 67.8% |
| Median | 66.2% | 67.7% |
| Interquartile 25% (IQ1) | 53.8% | 64.1% |
| Interquartile 75% (IQ3) | 71.5% | 74.0% |
| Interquartile Range (IQR) | 17.7% | 9.9% |
| Standard Deviation (Sample) | 14.9% | 11.2% |
| Standard Deviation (Population) | 14.7% | 11.1% |
Similar Demographics by College, Under 1 year
Demographics Similar to Icelanders by College, Under 1 year
In terms of college, under 1 year, the demographic groups most similar to Icelanders are European (68.2%, a difference of 0.030%), Luxembourger (68.2%, a difference of 0.040%), Ethiopian (68.3%, a difference of 0.060%), Croatian (68.3%, a difference of 0.070%), and Chinese (68.3%, a difference of 0.090%).
| Demographics | Rating | Rank | College, Under 1 year |
| Argentineans | 98.4 /100 | #83 | Exceptional 68.4% |
| Immigrants | Hungary | 98.3 /100 | #84 | Exceptional 68.3% |
| Egyptians | 98.3 /100 | #85 | Exceptional 68.3% |
| Immigrants | Lebanon | 98.3 /100 | #86 | Exceptional 68.3% |
| Chinese | 98.3 /100 | #87 | Exceptional 68.3% |
| Croatians | 98.2 /100 | #88 | Exceptional 68.3% |
| Ethiopians | 98.2 /100 | #89 | Exceptional 68.3% |
| Icelanders | 98.1 /100 | #90 | Exceptional 68.3% |
| Europeans | 98.1 /100 | #91 | Exceptional 68.2% |
| Luxembourgers | 98.1 /100 | #92 | Exceptional 68.2% |
| Romanians | 97.9 /100 | #93 | Exceptional 68.2% |
| Armenians | 97.7 /100 | #94 | Exceptional 68.1% |
| Immigrants | Pakistan | 97.5 /100 | #95 | Exceptional 68.0% |
| Jordanians | 97.4 /100 | #96 | Exceptional 68.0% |
| Immigrants | Ethiopia | 97.3 /100 | #97 | Exceptional 68.0% |
Demographics Similar to Immigrants from Syria by College, Under 1 year
In terms of college, under 1 year, the demographic groups most similar to Immigrants from Syria are Finnish (66.9%, a difference of 0.040%), Immigrants from Eastern Africa (67.0%, a difference of 0.060%), Polish (66.9%, a difference of 0.060%), Immigrants from Brazil (66.9%, a difference of 0.070%), and Iraqi (66.8%, a difference of 0.11%).
| Demographics | Rating | Rank | College, Under 1 year |
| Immigrants | Northern Africa | 92.7 /100 | #123 | Exceptional 67.2% |
| Arabs | 92.6 /100 | #124 | Exceptional 67.2% |
| Italians | 91.8 /100 | #125 | Exceptional 67.2% |
| Alsatians | 91.3 /100 | #126 | Exceptional 67.1% |
| Czechs | 90.8 /100 | #127 | Exceptional 67.1% |
| Scottish | 90.2 /100 | #128 | Exceptional 67.0% |
| Immigrants | Eastern Africa | 89.5 /100 | #129 | Excellent 67.0% |
| Immigrants | Syria | 89.0 /100 | #130 | Excellent 66.9% |
| Finns | 88.6 /100 | #131 | Excellent 66.9% |
| Poles | 88.4 /100 | #132 | Excellent 66.9% |
| Immigrants | Brazil | 88.3 /100 | #133 | Excellent 66.9% |
| Iraqis | 88.0 /100 | #134 | Excellent 66.8% |
| Canadians | 87.9 /100 | #135 | Excellent 66.8% |
| Ugandans | 87.8 /100 | #136 | Excellent 66.8% |
| Immigrants | Chile | 87.4 /100 | #137 | Excellent 66.8% |