Immigrants from Liberia vs Immigrants from Syria College, Under 1 year
COMPARE
Immigrants from Liberia
Immigrants from Syria
College, Under 1 year
College, Under 1 year Comparison
Immigrants from Liberia
Immigrants from Syria
61.9%
COLLEGE, UNDER 1 YEAR
0.8/ 100
METRIC RATING
247th/ 347
METRIC RANK
66.9%
COLLEGE, UNDER 1 YEAR
89.0/ 100
METRIC RATING
130th/ 347
METRIC RANK
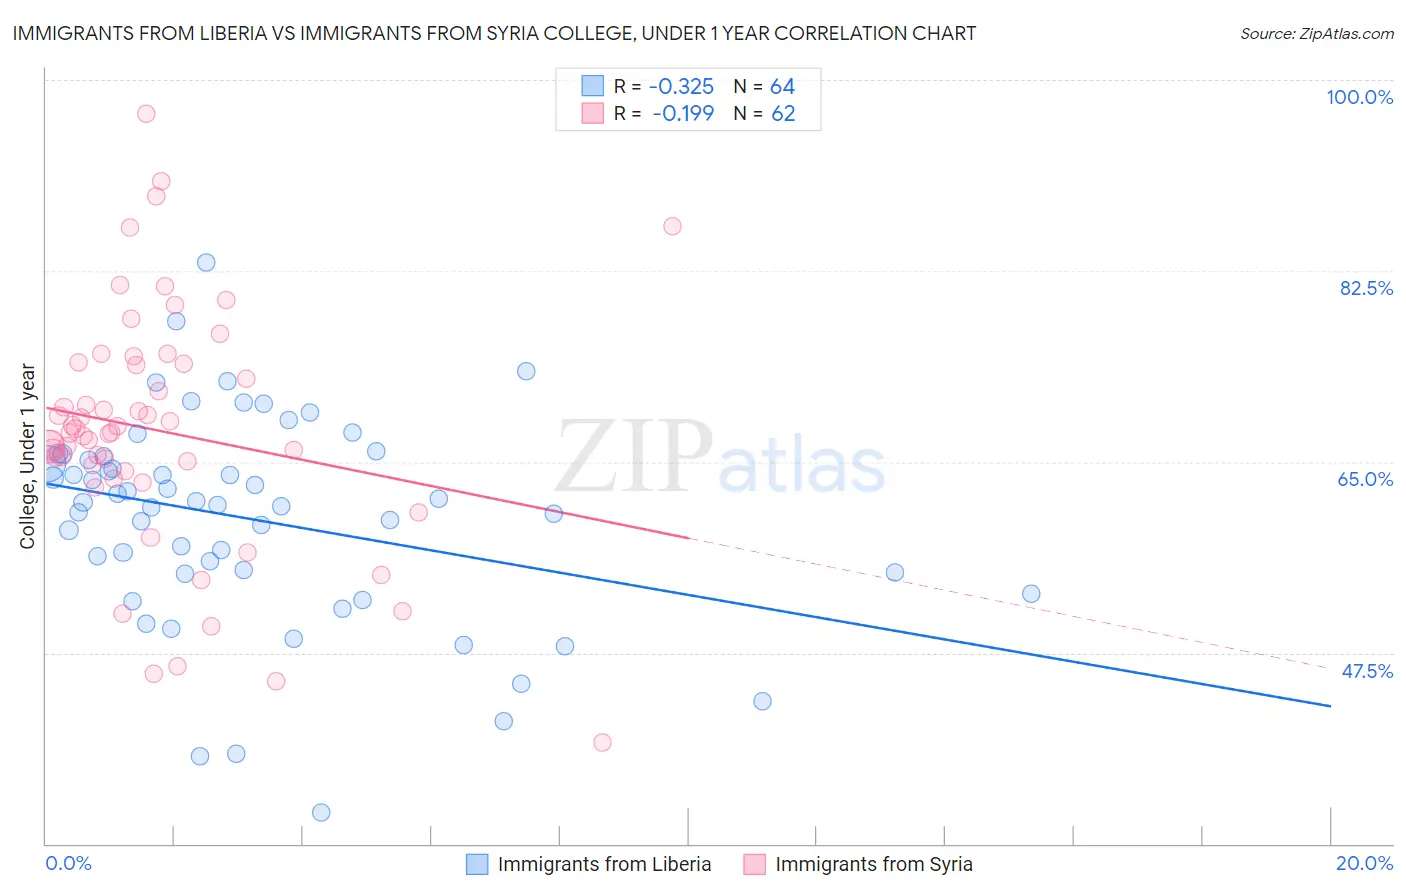
Immigrants from Liberia vs Immigrants from Syria College, Under 1 year Correlation Chart
The statistical analysis conducted on geographies consisting of 135,295,665 people shows a mild negative correlation between the proportion of Immigrants from Liberia and percentage of population with at least college, under 1 year education in the United States with a correlation coefficient (R) of -0.325 and weighted average of 61.9%. Similarly, the statistical analysis conducted on geographies consisting of 174,109,130 people shows a poor negative correlation between the proportion of Immigrants from Syria and percentage of population with at least college, under 1 year education in the United States with a correlation coefficient (R) of -0.199 and weighted average of 66.9%, a difference of 8.1%.
College, Under 1 year Correlation Summary
| Measurement | Immigrants from Liberia | Immigrants from Syria |
| Minimum | 32.8% | 39.2% |
| Maximum | 83.3% | 96.9% |
| Range | 50.5% | 57.7% |
| Mean | 59.7% | 67.8% |
| Median | 61.1% | 67.7% |
| Interquartile 25% (IQ1) | 54.8% | 64.1% |
| Interquartile 75% (IQ3) | 65.4% | 74.0% |
| Interquartile Range (IQR) | 10.6% | 9.9% |
| Standard Deviation (Sample) | 9.6% | 11.2% |
| Standard Deviation (Population) | 9.5% | 11.1% |
Similar Demographics by College, Under 1 year
Demographics Similar to Immigrants from Liberia by College, Under 1 year
In terms of college, under 1 year, the demographic groups most similar to Immigrants from Liberia are Marshallese (61.9%, a difference of 0.020%), Potawatomi (61.8%, a difference of 0.23%), Delaware (62.1%, a difference of 0.25%), Colville (62.1%, a difference of 0.31%), and Hawaiian (62.1%, a difference of 0.40%).
| Demographics | Rating | Rank | College, Under 1 year |
| Aleuts | 1.1 /100 | #240 | Tragic 62.2% |
| Ottawa | 1.1 /100 | #241 | Tragic 62.2% |
| Malaysians | 1.1 /100 | #242 | Tragic 62.2% |
| Hawaiians | 1.1 /100 | #243 | Tragic 62.1% |
| Colville | 1.0 /100 | #244 | Tragic 62.1% |
| Delaware | 0.9 /100 | #245 | Tragic 62.1% |
| Marshallese | 0.8 /100 | #246 | Tragic 61.9% |
| Immigrants | Liberia | 0.8 /100 | #247 | Tragic 61.9% |
| Potawatomi | 0.6 /100 | #248 | Tragic 61.8% |
| Vietnamese | 0.5 /100 | #249 | Tragic 61.7% |
| Immigrants | Congo | 0.5 /100 | #250 | Tragic 61.7% |
| Immigrants | Micronesia | 0.5 /100 | #251 | Tragic 61.5% |
| West Indians | 0.4 /100 | #252 | Tragic 61.5% |
| Japanese | 0.4 /100 | #253 | Tragic 61.5% |
| Immigrants | Cambodia | 0.4 /100 | #254 | Tragic 61.5% |
Demographics Similar to Immigrants from Syria by College, Under 1 year
In terms of college, under 1 year, the demographic groups most similar to Immigrants from Syria are Finnish (66.9%, a difference of 0.040%), Immigrants from Eastern Africa (67.0%, a difference of 0.060%), Polish (66.9%, a difference of 0.060%), Immigrants from Brazil (66.9%, a difference of 0.070%), and Iraqi (66.8%, a difference of 0.11%).
| Demographics | Rating | Rank | College, Under 1 year |
| Immigrants | Northern Africa | 92.7 /100 | #123 | Exceptional 67.2% |
| Arabs | 92.6 /100 | #124 | Exceptional 67.2% |
| Italians | 91.8 /100 | #125 | Exceptional 67.2% |
| Alsatians | 91.3 /100 | #126 | Exceptional 67.1% |
| Czechs | 90.8 /100 | #127 | Exceptional 67.1% |
| Scottish | 90.2 /100 | #128 | Exceptional 67.0% |
| Immigrants | Eastern Africa | 89.5 /100 | #129 | Excellent 67.0% |
| Immigrants | Syria | 89.0 /100 | #130 | Excellent 66.9% |
| Finns | 88.6 /100 | #131 | Excellent 66.9% |
| Poles | 88.4 /100 | #132 | Excellent 66.9% |
| Immigrants | Brazil | 88.3 /100 | #133 | Excellent 66.9% |
| Iraqis | 88.0 /100 | #134 | Excellent 66.8% |
| Canadians | 87.9 /100 | #135 | Excellent 66.8% |
| Ugandans | 87.8 /100 | #136 | Excellent 66.8% |
| Immigrants | Chile | 87.4 /100 | #137 | Excellent 66.8% |