Swiss vs Immigrants from Syria College, Under 1 year
COMPARE
Swiss
Immigrants from Syria
College, Under 1 year
College, Under 1 year Comparison
Swiss
Immigrants from Syria
65.5%
COLLEGE, UNDER 1 YEAR
53.9/ 100
METRIC RATING
173rd/ 347
METRIC RANK
66.9%
COLLEGE, UNDER 1 YEAR
89.0/ 100
METRIC RATING
130th/ 347
METRIC RANK
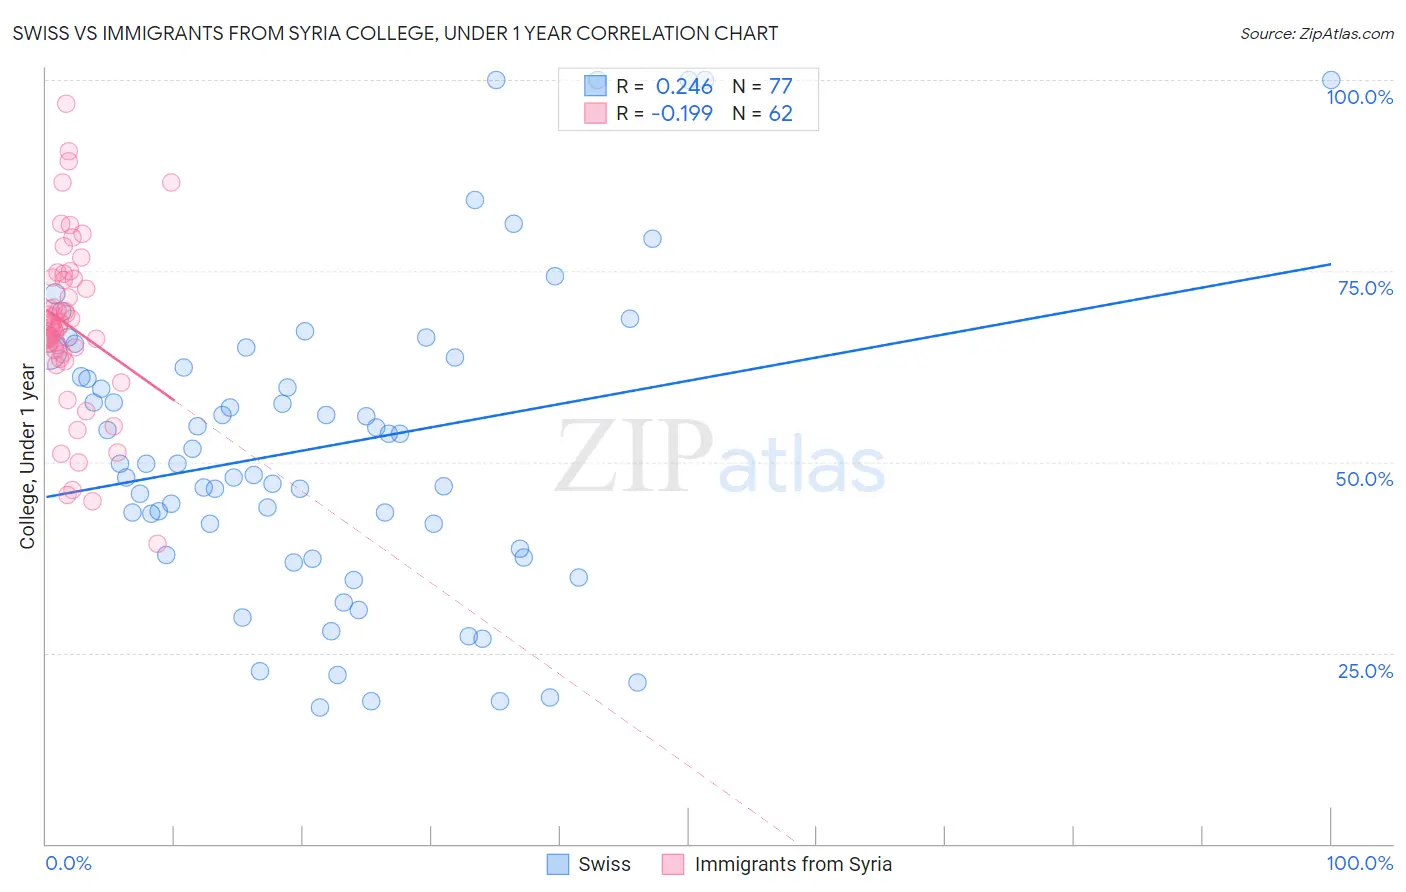
Swiss vs Immigrants from Syria College, Under 1 year Correlation Chart
The statistical analysis conducted on geographies consisting of 465,017,987 people shows a weak positive correlation between the proportion of Swiss and percentage of population with at least college, under 1 year education in the United States with a correlation coefficient (R) of 0.246 and weighted average of 65.5%. Similarly, the statistical analysis conducted on geographies consisting of 174,109,130 people shows a poor negative correlation between the proportion of Immigrants from Syria and percentage of population with at least college, under 1 year education in the United States with a correlation coefficient (R) of -0.199 and weighted average of 66.9%, a difference of 2.1%.
College, Under 1 year Correlation Summary
| Measurement | Swiss | Immigrants from Syria |
| Minimum | 17.9% | 39.2% |
| Maximum | 100.0% | 96.9% |
| Range | 82.1% | 57.7% |
| Mean | 52.0% | 67.8% |
| Median | 49.7% | 67.7% |
| Interquartile 25% (IQ1) | 38.2% | 64.1% |
| Interquartile 75% (IQ3) | 63.0% | 74.0% |
| Interquartile Range (IQR) | 24.8% | 9.9% |
| Standard Deviation (Sample) | 20.0% | 11.2% |
| Standard Deviation (Population) | 19.9% | 11.1% |
Similar Demographics by College, Under 1 year
Demographics Similar to Swiss by College, Under 1 year
In terms of college, under 1 year, the demographic groups most similar to Swiss are South American Indian (65.5%, a difference of 0.020%), Immigrants from Oceania (65.6%, a difference of 0.050%), Yugoslavian (65.6%, a difference of 0.080%), German (65.6%, a difference of 0.080%), and Hungarian (65.6%, a difference of 0.090%).
| Demographics | Rating | Rank | College, Under 1 year |
| Moroccans | 56.7 /100 | #166 | Average 65.6% |
| Immigrants | Somalia | 56.4 /100 | #167 | Average 65.6% |
| Hungarians | 55.9 /100 | #168 | Average 65.6% |
| Yugoslavians | 55.7 /100 | #169 | Average 65.6% |
| Germans | 55.7 /100 | #170 | Average 65.6% |
| Immigrants | Oceania | 55.0 /100 | #171 | Average 65.6% |
| South American Indians | 54.4 /100 | #172 | Average 65.5% |
| Swiss | 53.9 /100 | #173 | Average 65.5% |
| Immigrants | Bosnia and Herzegovina | 50.0 /100 | #174 | Average 65.4% |
| Scotch-Irish | 49.5 /100 | #175 | Average 65.4% |
| French | 48.9 /100 | #176 | Average 65.4% |
| Immigrants | North Macedonia | 48.6 /100 | #177 | Average 65.4% |
| German Russians | 48.3 /100 | #178 | Average 65.4% |
| Guamanians/Chamorros | 48.2 /100 | #179 | Average 65.4% |
| Dutch | 46.1 /100 | #180 | Average 65.3% |
Demographics Similar to Immigrants from Syria by College, Under 1 year
In terms of college, under 1 year, the demographic groups most similar to Immigrants from Syria are Finnish (66.9%, a difference of 0.040%), Immigrants from Eastern Africa (67.0%, a difference of 0.060%), Polish (66.9%, a difference of 0.060%), Immigrants from Brazil (66.9%, a difference of 0.070%), and Iraqi (66.8%, a difference of 0.11%).
| Demographics | Rating | Rank | College, Under 1 year |
| Immigrants | Northern Africa | 92.7 /100 | #123 | Exceptional 67.2% |
| Arabs | 92.6 /100 | #124 | Exceptional 67.2% |
| Italians | 91.8 /100 | #125 | Exceptional 67.2% |
| Alsatians | 91.3 /100 | #126 | Exceptional 67.1% |
| Czechs | 90.8 /100 | #127 | Exceptional 67.1% |
| Scottish | 90.2 /100 | #128 | Exceptional 67.0% |
| Immigrants | Eastern Africa | 89.5 /100 | #129 | Excellent 67.0% |
| Immigrants | Syria | 89.0 /100 | #130 | Excellent 66.9% |
| Finns | 88.6 /100 | #131 | Excellent 66.9% |
| Poles | 88.4 /100 | #132 | Excellent 66.9% |
| Immigrants | Brazil | 88.3 /100 | #133 | Excellent 66.9% |
| Iraqis | 88.0 /100 | #134 | Excellent 66.8% |
| Canadians | 87.9 /100 | #135 | Excellent 66.8% |
| Ugandans | 87.8 /100 | #136 | Excellent 66.8% |
| Immigrants | Chile | 87.4 /100 | #137 | Excellent 66.8% |