British vs Cree College, Under 1 year
COMPARE
British
Cree
College, Under 1 year
College, Under 1 year Comparison
British
Cree
68.5%
COLLEGE, UNDER 1 YEAR
98.6/ 100
METRIC RATING
77th/ 347
METRIC RANK
63.3%
COLLEGE, UNDER 1 YEAR
5.2/ 100
METRIC RATING
221st/ 347
METRIC RANK
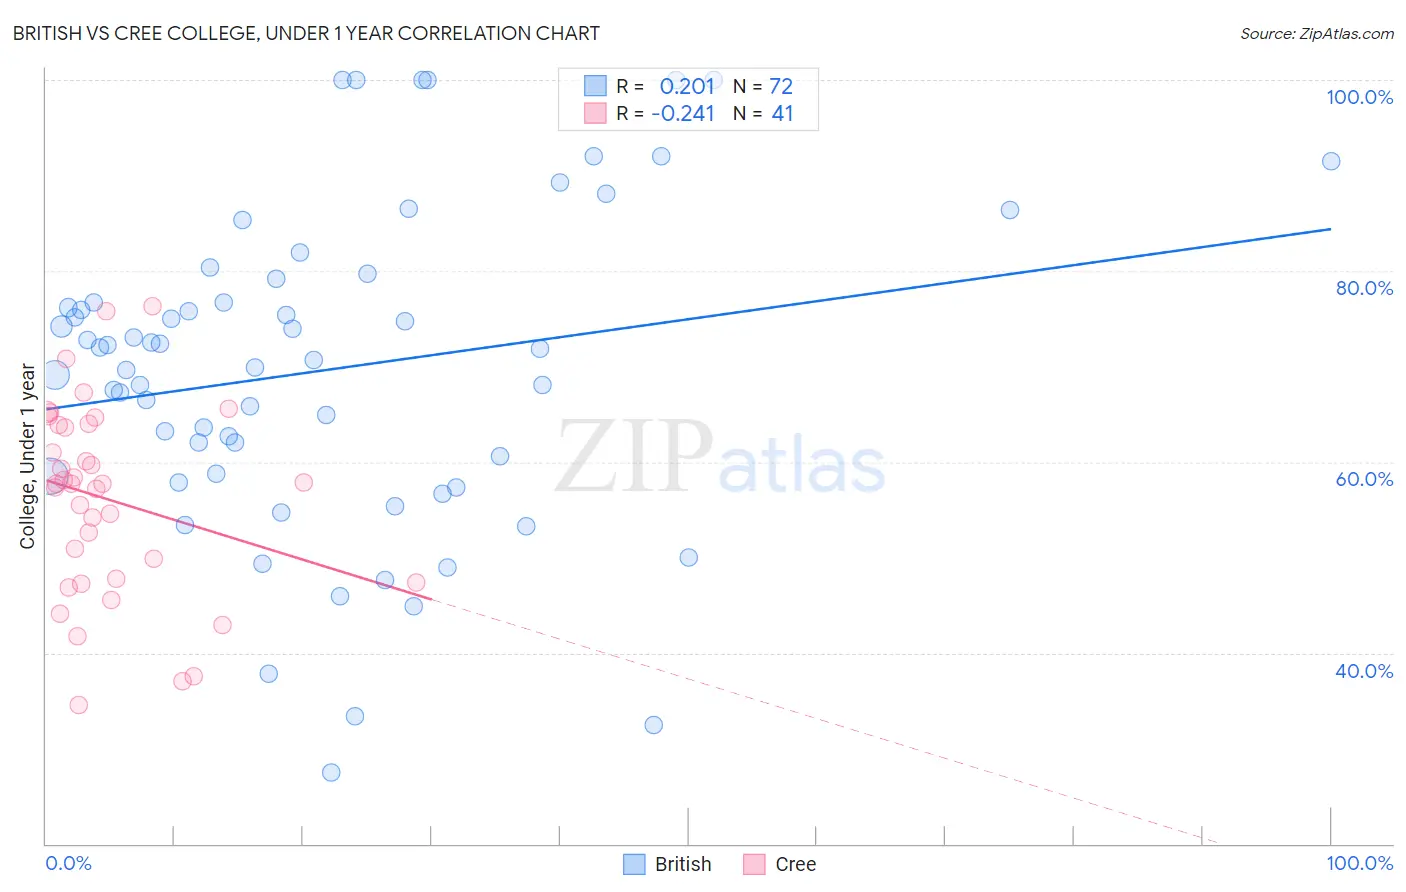
British vs Cree College, Under 1 year Correlation Chart
The statistical analysis conducted on geographies consisting of 531,460,716 people shows a weak positive correlation between the proportion of British and percentage of population with at least college, under 1 year education in the United States with a correlation coefficient (R) of 0.201 and weighted average of 68.5%. Similarly, the statistical analysis conducted on geographies consisting of 76,211,744 people shows a weak negative correlation between the proportion of Cree and percentage of population with at least college, under 1 year education in the United States with a correlation coefficient (R) of -0.241 and weighted average of 63.3%, a difference of 8.1%.
College, Under 1 year Correlation Summary
| Measurement | British | Cree |
| Minimum | 27.5% | 34.5% |
| Maximum | 100.0% | 76.2% |
| Range | 72.5% | 41.7% |
| Mean | 69.6% | 56.1% |
| Median | 71.2% | 57.7% |
| Interquartile 25% (IQ1) | 58.6% | 47.5% |
| Interquartile 75% (IQ3) | 77.9% | 63.9% |
| Interquartile Range (IQR) | 19.3% | 16.4% |
| Standard Deviation (Sample) | 16.7% | 10.0% |
| Standard Deviation (Population) | 16.6% | 9.9% |
Similar Demographics by College, Under 1 year
Demographics Similar to British by College, Under 1 year
In terms of college, under 1 year, the demographic groups most similar to British are Danish (68.5%, a difference of 0.010%), Greek (68.5%, a difference of 0.020%), Immigrants from Western Europe (68.5%, a difference of 0.040%), Laotian (68.5%, a difference of 0.040%), and Immigrants from Spain (68.4%, a difference of 0.050%).
| Demographics | Rating | Rank | College, Under 1 year |
| Lithuanians | 99.1 /100 | #70 | Exceptional 68.8% |
| Immigrants | Europe | 99.1 /100 | #71 | Exceptional 68.8% |
| Bolivians | 99.0 /100 | #72 | Exceptional 68.7% |
| Immigrants | England | 99.0 /100 | #73 | Exceptional 68.7% |
| Swedes | 98.9 /100 | #74 | Exceptional 68.7% |
| Immigrants | Western Europe | 98.6 /100 | #75 | Exceptional 68.5% |
| Laotians | 98.6 /100 | #76 | Exceptional 68.5% |
| British | 98.6 /100 | #77 | Exceptional 68.5% |
| Danes | 98.6 /100 | #78 | Exceptional 68.5% |
| Greeks | 98.6 /100 | #79 | Exceptional 68.5% |
| Immigrants | Spain | 98.5 /100 | #80 | Exceptional 68.4% |
| Immigrants | Greece | 98.5 /100 | #81 | Exceptional 68.4% |
| Norwegians | 98.4 /100 | #82 | Exceptional 68.4% |
| Argentineans | 98.4 /100 | #83 | Exceptional 68.4% |
| Immigrants | Hungary | 98.3 /100 | #84 | Exceptional 68.3% |
Demographics Similar to Cree by College, Under 1 year
In terms of college, under 1 year, the demographic groups most similar to Cree are Immigrants from Senegal (63.3%, a difference of 0.050%), Portuguese (63.4%, a difference of 0.090%), Immigrants from Panama (63.4%, a difference of 0.11%), Immigrants from Fiji (63.4%, a difference of 0.11%), and Immigrants from Uruguay (63.4%, a difference of 0.14%).
| Demographics | Rating | Rank | College, Under 1 year |
| Immigrants | Nigeria | 8.8 /100 | #214 | Tragic 63.7% |
| Senegalese | 7.7 /100 | #215 | Tragic 63.6% |
| Hmong | 6.8 /100 | #216 | Tragic 63.5% |
| Immigrants | Uruguay | 5.8 /100 | #217 | Tragic 63.4% |
| Immigrants | Panama | 5.7 /100 | #218 | Tragic 63.4% |
| Immigrants | Fiji | 5.7 /100 | #219 | Tragic 63.4% |
| Portuguese | 5.6 /100 | #220 | Tragic 63.4% |
| Cree | 5.2 /100 | #221 | Tragic 63.3% |
| Immigrants | Senegal | 5.0 /100 | #222 | Tragic 63.3% |
| Immigrants | Costa Rica | 4.5 /100 | #223 | Tragic 63.2% |
| Sub-Saharan Africans | 4.4 /100 | #224 | Tragic 63.2% |
| Immigrants | Peru | 4.0 /100 | #225 | Tragic 63.1% |
| Immigrants | Colombia | 4.0 /100 | #226 | Tragic 63.1% |
| Immigrants | Ghana | 3.7 /100 | #227 | Tragic 63.1% |
| Samoans | 3.3 /100 | #228 | Tragic 63.0% |