Delaware vs Cree College, Under 1 year
COMPARE
Delaware
Cree
College, Under 1 year
College, Under 1 year Comparison
Delaware
Cree
62.1%
COLLEGE, UNDER 1 YEAR
0.9/ 100
METRIC RATING
245th/ 347
METRIC RANK
63.3%
COLLEGE, UNDER 1 YEAR
5.2/ 100
METRIC RATING
221st/ 347
METRIC RANK
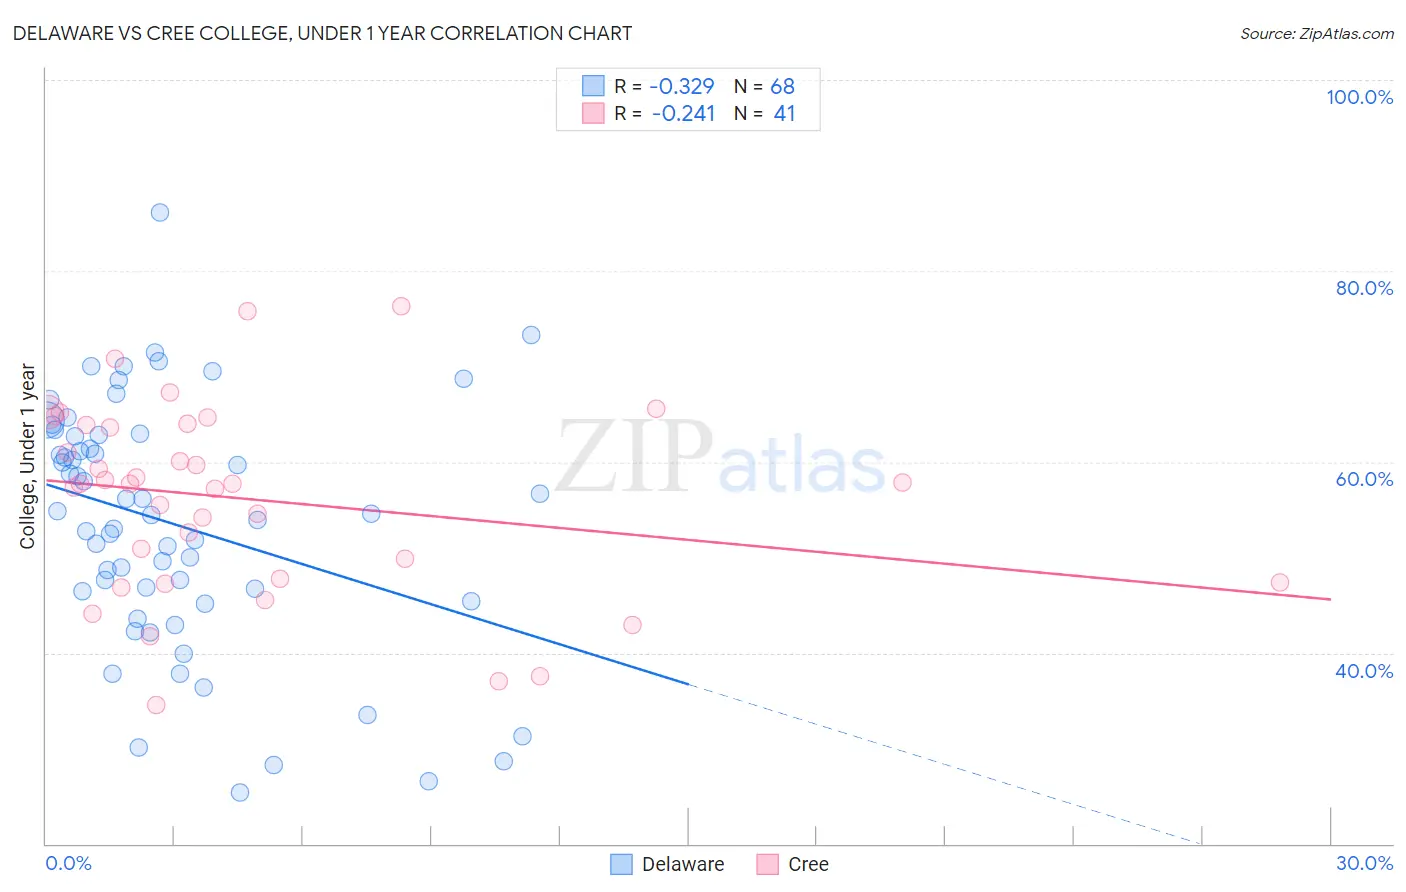
Delaware vs Cree College, Under 1 year Correlation Chart
The statistical analysis conducted on geographies consisting of 96,235,398 people shows a mild negative correlation between the proportion of Delaware and percentage of population with at least college, under 1 year education in the United States with a correlation coefficient (R) of -0.329 and weighted average of 62.1%. Similarly, the statistical analysis conducted on geographies consisting of 76,211,744 people shows a weak negative correlation between the proportion of Cree and percentage of population with at least college, under 1 year education in the United States with a correlation coefficient (R) of -0.241 and weighted average of 63.3%, a difference of 2.0%.
College, Under 1 year Correlation Summary
| Measurement | Delaware | Cree |
| Minimum | 25.3% | 34.5% |
| Maximum | 86.2% | 76.2% |
| Range | 60.9% | 41.7% |
| Mean | 53.5% | 56.1% |
| Median | 54.5% | 57.7% |
| Interquartile 25% (IQ1) | 45.9% | 47.5% |
| Interquartile 75% (IQ3) | 62.7% | 63.9% |
| Interquartile Range (IQR) | 16.8% | 16.4% |
| Standard Deviation (Sample) | 12.8% | 10.0% |
| Standard Deviation (Population) | 12.7% | 9.9% |
Similar Demographics by College, Under 1 year
Demographics Similar to Delaware by College, Under 1 year
In terms of college, under 1 year, the demographic groups most similar to Delaware are Colville (62.1%, a difference of 0.060%), Hawaiian (62.1%, a difference of 0.15%), Malaysian (62.2%, a difference of 0.18%), Marshallese (61.9%, a difference of 0.22%), and Ottawa (62.2%, a difference of 0.23%).
| Demographics | Rating | Rank | College, Under 1 year |
| French American Indians | 1.5 /100 | #238 | Tragic 62.4% |
| Nepalese | 1.1 /100 | #239 | Tragic 62.2% |
| Aleuts | 1.1 /100 | #240 | Tragic 62.2% |
| Ottawa | 1.1 /100 | #241 | Tragic 62.2% |
| Malaysians | 1.1 /100 | #242 | Tragic 62.2% |
| Hawaiians | 1.1 /100 | #243 | Tragic 62.1% |
| Colville | 1.0 /100 | #244 | Tragic 62.1% |
| Delaware | 0.9 /100 | #245 | Tragic 62.1% |
| Marshallese | 0.8 /100 | #246 | Tragic 61.9% |
| Immigrants | Liberia | 0.8 /100 | #247 | Tragic 61.9% |
| Potawatomi | 0.6 /100 | #248 | Tragic 61.8% |
| Vietnamese | 0.5 /100 | #249 | Tragic 61.7% |
| Immigrants | Congo | 0.5 /100 | #250 | Tragic 61.7% |
| Immigrants | Micronesia | 0.5 /100 | #251 | Tragic 61.5% |
| West Indians | 0.4 /100 | #252 | Tragic 61.5% |
Demographics Similar to Cree by College, Under 1 year
In terms of college, under 1 year, the demographic groups most similar to Cree are Immigrants from Senegal (63.3%, a difference of 0.050%), Portuguese (63.4%, a difference of 0.090%), Immigrants from Panama (63.4%, a difference of 0.11%), Immigrants from Fiji (63.4%, a difference of 0.11%), and Immigrants from Uruguay (63.4%, a difference of 0.14%).
| Demographics | Rating | Rank | College, Under 1 year |
| Immigrants | Nigeria | 8.8 /100 | #214 | Tragic 63.7% |
| Senegalese | 7.7 /100 | #215 | Tragic 63.6% |
| Hmong | 6.8 /100 | #216 | Tragic 63.5% |
| Immigrants | Uruguay | 5.8 /100 | #217 | Tragic 63.4% |
| Immigrants | Panama | 5.7 /100 | #218 | Tragic 63.4% |
| Immigrants | Fiji | 5.7 /100 | #219 | Tragic 63.4% |
| Portuguese | 5.6 /100 | #220 | Tragic 63.4% |
| Cree | 5.2 /100 | #221 | Tragic 63.3% |
| Immigrants | Senegal | 5.0 /100 | #222 | Tragic 63.3% |
| Immigrants | Costa Rica | 4.5 /100 | #223 | Tragic 63.2% |
| Sub-Saharan Africans | 4.4 /100 | #224 | Tragic 63.2% |
| Immigrants | Peru | 4.0 /100 | #225 | Tragic 63.1% |
| Immigrants | Colombia | 4.0 /100 | #226 | Tragic 63.1% |
| Immigrants | Ghana | 3.7 /100 | #227 | Tragic 63.1% |
| Samoans | 3.3 /100 | #228 | Tragic 63.0% |