Immigrants from Egypt vs Swedish College, Under 1 year
COMPARE
Immigrants from Egypt
Swedish
College, Under 1 year
College, Under 1 year Comparison
Immigrants from Egypt
Swedes
67.7%
COLLEGE, UNDER 1 YEAR
96.0/ 100
METRIC RATING
108th/ 347
METRIC RANK
68.7%
COLLEGE, UNDER 1 YEAR
98.9/ 100
METRIC RATING
74th/ 347
METRIC RANK
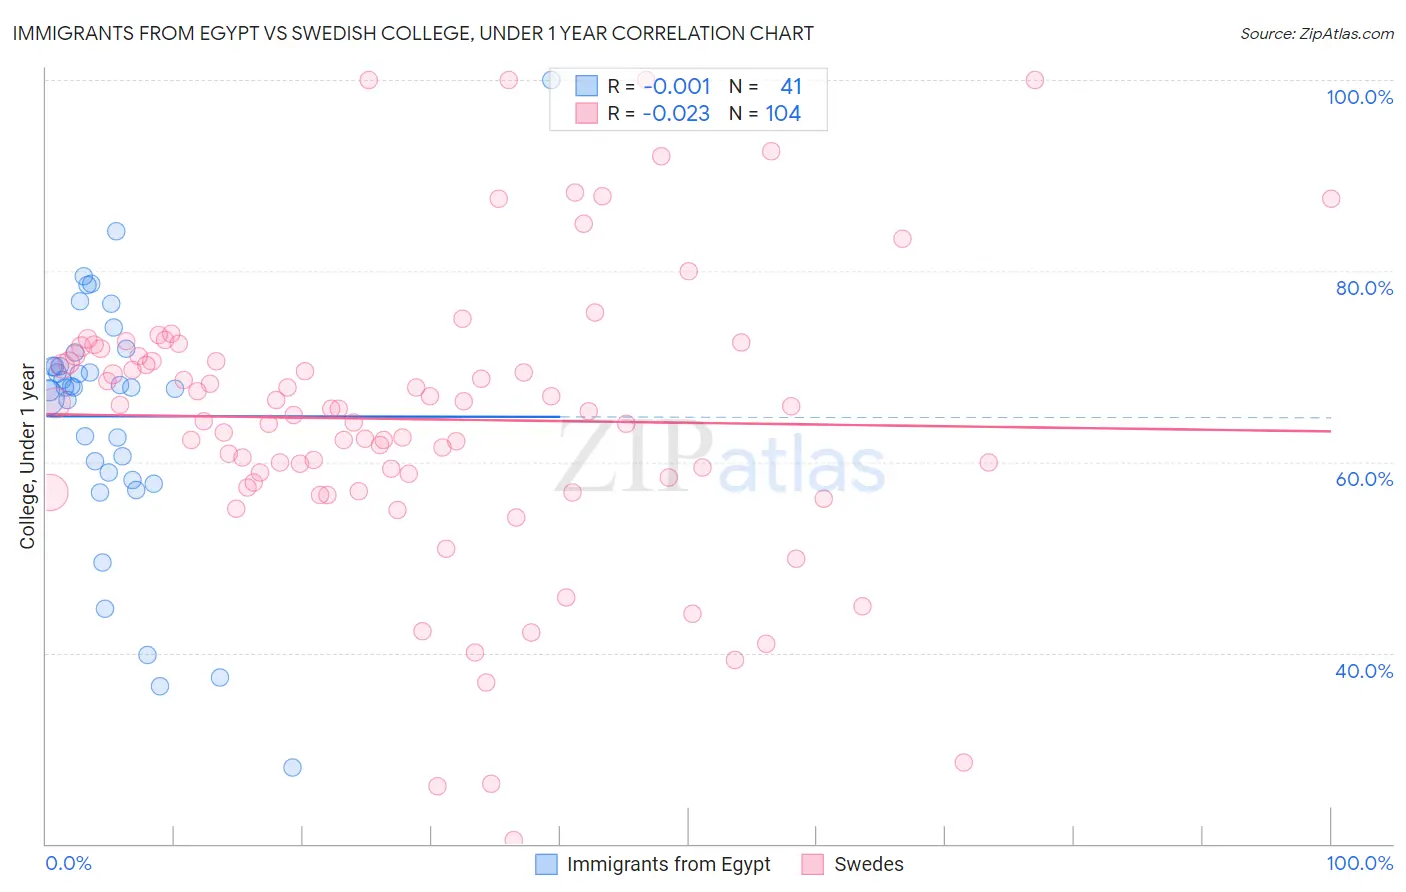
Immigrants from Egypt vs Swedish College, Under 1 year Correlation Chart
The statistical analysis conducted on geographies consisting of 245,485,794 people shows no correlation between the proportion of Immigrants from Egypt and percentage of population with at least college, under 1 year education in the United States with a correlation coefficient (R) of -0.001 and weighted average of 67.7%. Similarly, the statistical analysis conducted on geographies consisting of 539,226,208 people shows no correlation between the proportion of Swedes and percentage of population with at least college, under 1 year education in the United States with a correlation coefficient (R) of -0.023 and weighted average of 68.7%, a difference of 1.4%.
College, Under 1 year Correlation Summary
| Measurement | Immigrants from Egypt | Swedish |
| Minimum | 28.0% | 20.5% |
| Maximum | 100.0% | 100.0% |
| Range | 72.0% | 79.5% |
| Mean | 64.8% | 64.5% |
| Median | 67.8% | 65.4% |
| Interquartile 25% (IQ1) | 58.6% | 58.1% |
| Interquartile 75% (IQ3) | 70.7% | 71.1% |
| Interquartile Range (IQR) | 12.1% | 13.1% |
| Standard Deviation (Sample) | 13.6% | 15.1% |
| Standard Deviation (Population) | 13.4% | 15.0% |
Similar Demographics by College, Under 1 year
Demographics Similar to Immigrants from Egypt by College, Under 1 year
In terms of college, under 1 year, the demographic groups most similar to Immigrants from Egypt are Scandinavian (67.7%, a difference of 0.060%), Assyrian/Chaldean/Syriac (67.7%, a difference of 0.060%), Ukrainian (67.7%, a difference of 0.060%), Macedonian (67.6%, a difference of 0.080%), and Syrian (67.6%, a difference of 0.11%).
| Demographics | Rating | Rank | College, Under 1 year |
| Immigrants | Eastern Europe | 96.9 /100 | #101 | Exceptional 67.9% |
| Palestinians | 96.9 /100 | #102 | Exceptional 67.9% |
| Carpatho Rusyns | 96.8 /100 | #103 | Exceptional 67.9% |
| Immigrants | Western Asia | 96.6 /100 | #104 | Exceptional 67.8% |
| Afghans | 96.6 /100 | #105 | Exceptional 67.8% |
| Immigrants | Croatia | 96.6 /100 | #106 | Exceptional 67.8% |
| Austrians | 96.4 /100 | #107 | Exceptional 67.8% |
| Immigrants | Egypt | 96.0 /100 | #108 | Exceptional 67.7% |
| Scandinavians | 95.8 /100 | #109 | Exceptional 67.7% |
| Assyrians/Chaldeans/Syriacs | 95.8 /100 | #110 | Exceptional 67.7% |
| Ukrainians | 95.8 /100 | #111 | Exceptional 67.7% |
| Macedonians | 95.7 /100 | #112 | Exceptional 67.6% |
| Syrians | 95.6 /100 | #113 | Exceptional 67.6% |
| Chileans | 95.3 /100 | #114 | Exceptional 67.6% |
| Basques | 95.2 /100 | #115 | Exceptional 67.6% |
Demographics Similar to Swedes by College, Under 1 year
In terms of college, under 1 year, the demographic groups most similar to Swedes are Immigrants from England (68.7%, a difference of 0.060%), Bolivian (68.7%, a difference of 0.090%), Immigrants from Europe (68.8%, a difference of 0.14%), Lithuanian (68.8%, a difference of 0.15%), and Immigrants from Western Europe (68.5%, a difference of 0.25%).
| Demographics | Rating | Rank | College, Under 1 year |
| Immigrants | Zimbabwe | 99.2 /100 | #67 | Exceptional 68.9% |
| Immigrants | Indonesia | 99.2 /100 | #68 | Exceptional 68.9% |
| Immigrants | Romania | 99.2 /100 | #69 | Exceptional 68.9% |
| Lithuanians | 99.1 /100 | #70 | Exceptional 68.8% |
| Immigrants | Europe | 99.1 /100 | #71 | Exceptional 68.8% |
| Bolivians | 99.0 /100 | #72 | Exceptional 68.7% |
| Immigrants | England | 99.0 /100 | #73 | Exceptional 68.7% |
| Swedes | 98.9 /100 | #74 | Exceptional 68.7% |
| Immigrants | Western Europe | 98.6 /100 | #75 | Exceptional 68.5% |
| Laotians | 98.6 /100 | #76 | Exceptional 68.5% |
| British | 98.6 /100 | #77 | Exceptional 68.5% |
| Danes | 98.6 /100 | #78 | Exceptional 68.5% |
| Greeks | 98.6 /100 | #79 | Exceptional 68.5% |
| Immigrants | Spain | 98.5 /100 | #80 | Exceptional 68.4% |
| Immigrants | Greece | 98.5 /100 | #81 | Exceptional 68.4% |