Immigrants from Egypt vs Immigrants from the Azores College, Under 1 year
COMPARE
Immigrants from Egypt
Immigrants from the Azores
College, Under 1 year
College, Under 1 year Comparison
Immigrants from Egypt
Immigrants from the Azores
67.7%
COLLEGE, UNDER 1 YEAR
96.0/ 100
METRIC RATING
108th/ 347
METRIC RANK
54.7%
COLLEGE, UNDER 1 YEAR
0.0/ 100
METRIC RATING
334th/ 347
METRIC RANK
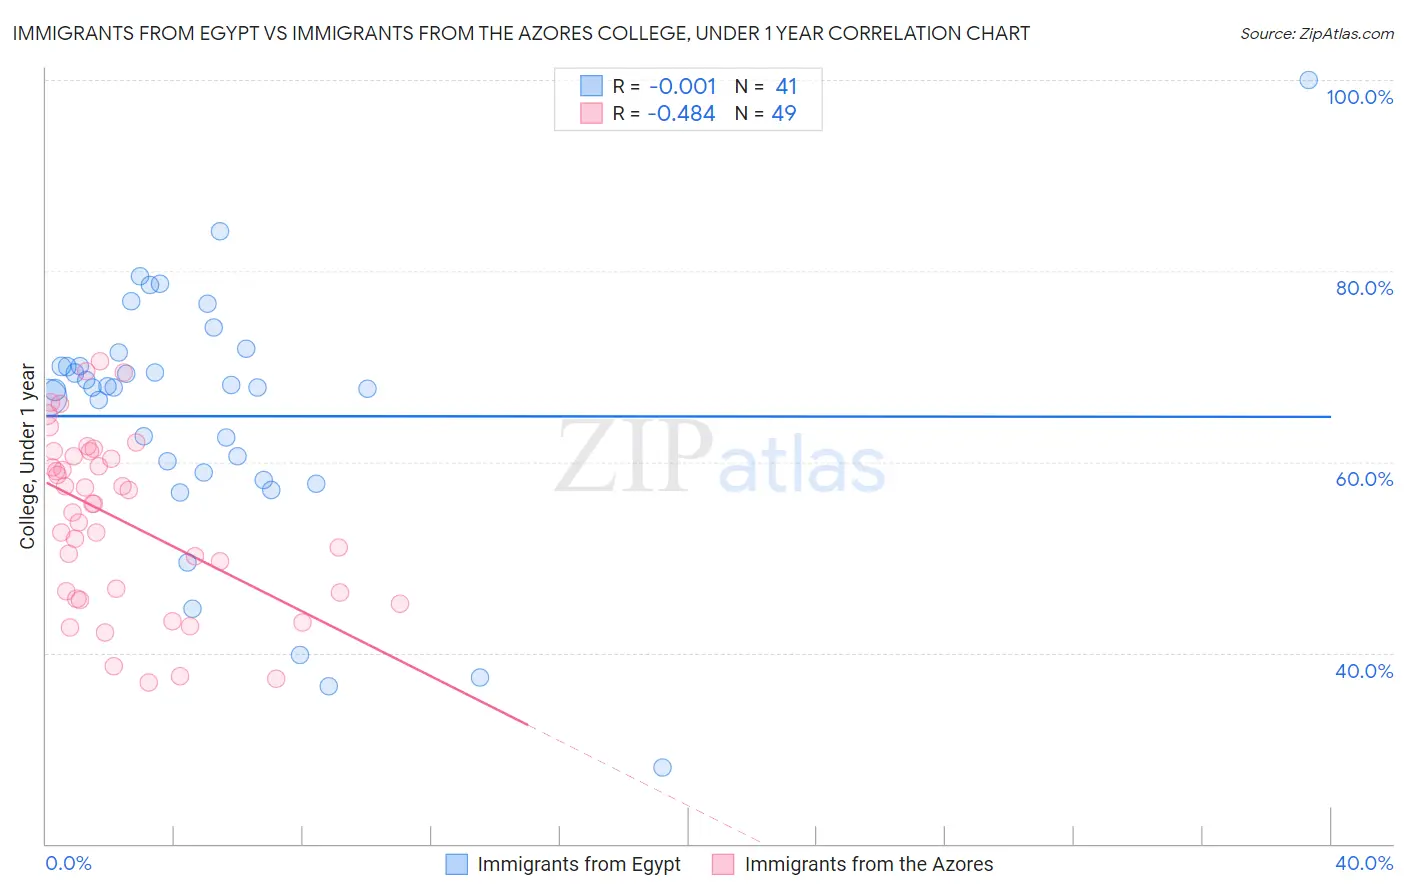
Immigrants from Egypt vs Immigrants from the Azores College, Under 1 year Correlation Chart
The statistical analysis conducted on geographies consisting of 245,485,794 people shows no correlation between the proportion of Immigrants from Egypt and percentage of population with at least college, under 1 year education in the United States with a correlation coefficient (R) of -0.001 and weighted average of 67.7%. Similarly, the statistical analysis conducted on geographies consisting of 46,257,310 people shows a moderate negative correlation between the proportion of Immigrants from the Azores and percentage of population with at least college, under 1 year education in the United States with a correlation coefficient (R) of -0.484 and weighted average of 54.7%, a difference of 23.8%.
College, Under 1 year Correlation Summary
| Measurement | Immigrants from Egypt | Immigrants from the Azores |
| Minimum | 28.0% | 36.9% |
| Maximum | 100.0% | 70.6% |
| Range | 72.0% | 33.6% |
| Mean | 64.8% | 53.9% |
| Median | 67.8% | 55.6% |
| Interquartile 25% (IQ1) | 58.6% | 46.0% |
| Interquartile 75% (IQ3) | 70.7% | 60.8% |
| Interquartile Range (IQR) | 12.1% | 14.8% |
| Standard Deviation (Sample) | 13.6% | 9.1% |
| Standard Deviation (Population) | 13.4% | 9.0% |
Similar Demographics by College, Under 1 year
Demographics Similar to Immigrants from Egypt by College, Under 1 year
In terms of college, under 1 year, the demographic groups most similar to Immigrants from Egypt are Scandinavian (67.7%, a difference of 0.060%), Assyrian/Chaldean/Syriac (67.7%, a difference of 0.060%), Ukrainian (67.7%, a difference of 0.060%), Macedonian (67.6%, a difference of 0.080%), and Syrian (67.6%, a difference of 0.11%).
| Demographics | Rating | Rank | College, Under 1 year |
| Immigrants | Eastern Europe | 96.9 /100 | #101 | Exceptional 67.9% |
| Palestinians | 96.9 /100 | #102 | Exceptional 67.9% |
| Carpatho Rusyns | 96.8 /100 | #103 | Exceptional 67.9% |
| Immigrants | Western Asia | 96.6 /100 | #104 | Exceptional 67.8% |
| Afghans | 96.6 /100 | #105 | Exceptional 67.8% |
| Immigrants | Croatia | 96.6 /100 | #106 | Exceptional 67.8% |
| Austrians | 96.4 /100 | #107 | Exceptional 67.8% |
| Immigrants | Egypt | 96.0 /100 | #108 | Exceptional 67.7% |
| Scandinavians | 95.8 /100 | #109 | Exceptional 67.7% |
| Assyrians/Chaldeans/Syriacs | 95.8 /100 | #110 | Exceptional 67.7% |
| Ukrainians | 95.8 /100 | #111 | Exceptional 67.7% |
| Macedonians | 95.7 /100 | #112 | Exceptional 67.6% |
| Syrians | 95.6 /100 | #113 | Exceptional 67.6% |
| Chileans | 95.3 /100 | #114 | Exceptional 67.6% |
| Basques | 95.2 /100 | #115 | Exceptional 67.6% |
Demographics Similar to Immigrants from the Azores by College, Under 1 year
In terms of college, under 1 year, the demographic groups most similar to Immigrants from the Azores are Inupiat (54.6%, a difference of 0.13%), Pennsylvania German (54.5%, a difference of 0.30%), Immigrants from Central America (54.4%, a difference of 0.45%), Yuman (55.1%, a difference of 0.72%), and Lumbee (54.2%, a difference of 0.86%).
| Demographics | Rating | Rank | College, Under 1 year |
| Immigrants | Guatemala | 0.0 /100 | #327 | Tragic 56.2% |
| Cape Verdeans | 0.0 /100 | #328 | Tragic 56.0% |
| Immigrants | Cuba | 0.0 /100 | #329 | Tragic 55.7% |
| Mexicans | 0.0 /100 | #330 | Tragic 55.6% |
| Dominicans | 0.0 /100 | #331 | Tragic 55.5% |
| Immigrants | Yemen | 0.0 /100 | #332 | Tragic 55.3% |
| Yuman | 0.0 /100 | #333 | Tragic 55.1% |
| Immigrants | Azores | 0.0 /100 | #334 | Tragic 54.7% |
| Inupiat | 0.0 /100 | #335 | Tragic 54.6% |
| Pennsylvania Germans | 0.0 /100 | #336 | Tragic 54.5% |
| Immigrants | Central America | 0.0 /100 | #337 | Tragic 54.4% |
| Lumbee | 0.0 /100 | #338 | Tragic 54.2% |
| Immigrants | Dominican Republic | 0.0 /100 | #339 | Tragic 54.0% |
| Spanish American Indians | 0.0 /100 | #340 | Tragic 54.0% |
| Immigrants | Cabo Verde | 0.0 /100 | #341 | Tragic 53.7% |