Black/African American vs Cree College, Under 1 year
COMPARE
Black/African American
Cree
College, Under 1 year
College, Under 1 year Comparison
Blacks/African Americans
Cree
59.4%
COLLEGE, UNDER 1 YEAR
0.0/ 100
METRIC RATING
288th/ 347
METRIC RANK
63.3%
COLLEGE, UNDER 1 YEAR
5.2/ 100
METRIC RATING
221st/ 347
METRIC RANK
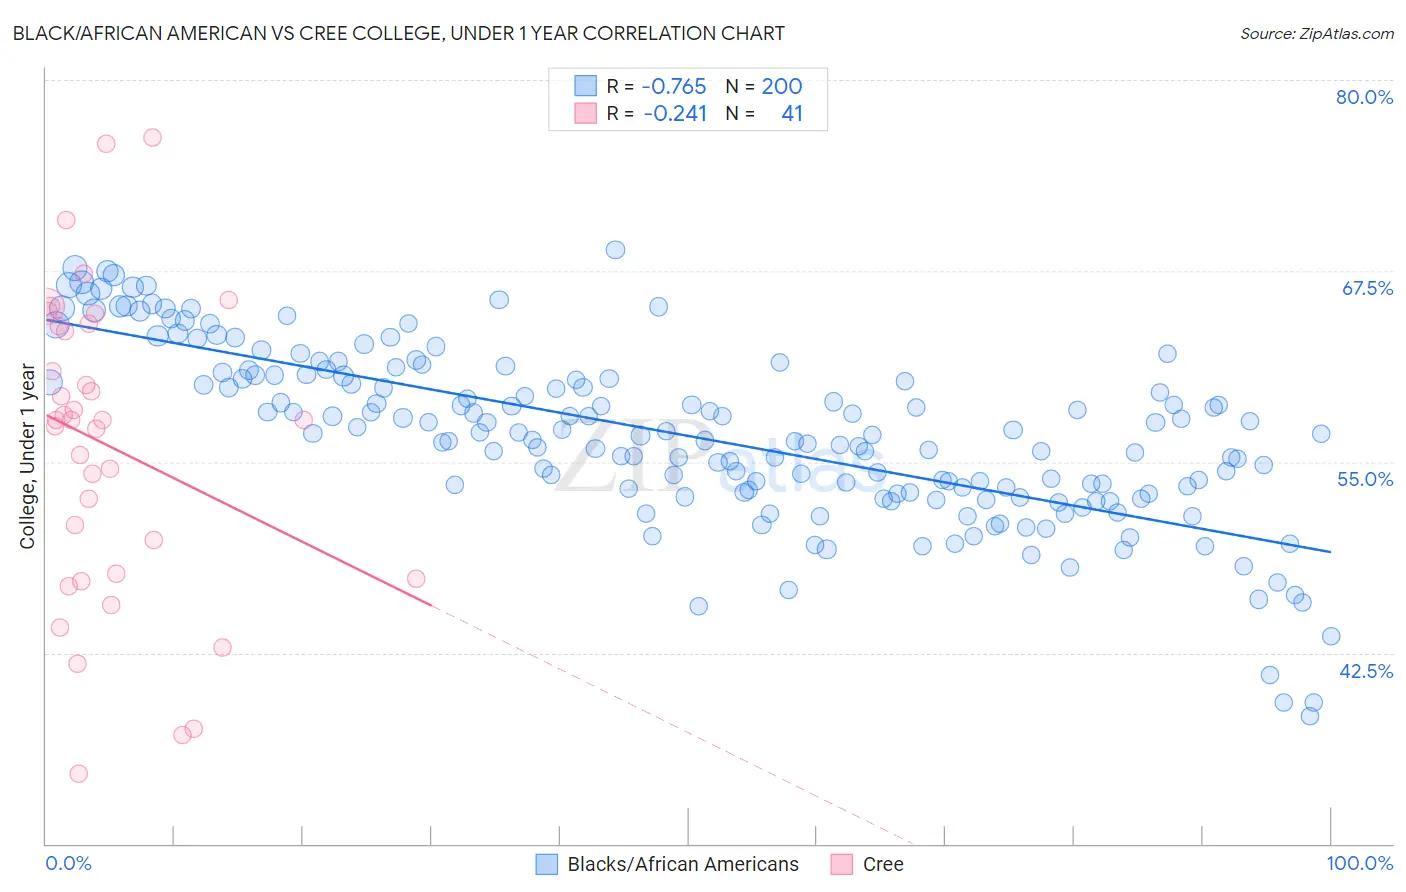
Black/African American vs Cree College, Under 1 year Correlation Chart
The statistical analysis conducted on geographies consisting of 566,038,640 people shows a strong negative correlation between the proportion of Blacks/African Americans and percentage of population with at least college, under 1 year education in the United States with a correlation coefficient (R) of -0.765 and weighted average of 59.4%. Similarly, the statistical analysis conducted on geographies consisting of 76,211,744 people shows a weak negative correlation between the proportion of Cree and percentage of population with at least college, under 1 year education in the United States with a correlation coefficient (R) of -0.241 and weighted average of 63.3%, a difference of 6.6%.
College, Under 1 year Correlation Summary
| Measurement | Black/African American | Cree |
| Minimum | 38.4% | 34.5% |
| Maximum | 68.9% | 76.2% |
| Range | 30.5% | 41.7% |
| Mean | 56.7% | 56.1% |
| Median | 56.8% | 57.7% |
| Interquartile 25% (IQ1) | 53.0% | 47.5% |
| Interquartile 75% (IQ3) | 60.7% | 63.9% |
| Interquartile Range (IQR) | 7.6% | 16.4% |
| Standard Deviation (Sample) | 5.8% | 10.0% |
| Standard Deviation (Population) | 5.7% | 9.9% |
Similar Demographics by College, Under 1 year
Demographics Similar to Blacks/African Americans by College, Under 1 year
In terms of college, under 1 year, the demographic groups most similar to Blacks/African Americans are Choctaw (59.3%, a difference of 0.070%), Sioux (59.4%, a difference of 0.10%), Ecuadorian (59.3%, a difference of 0.11%), Creek (59.3%, a difference of 0.20%), and Nicaraguan (59.2%, a difference of 0.24%).
| Demographics | Rating | Rank | College, Under 1 year |
| Cherokee | 0.1 /100 | #281 | Tragic 60.1% |
| Belizeans | 0.1 /100 | #282 | Tragic 60.1% |
| Immigrants | Jamaica | 0.0 /100 | #283 | Tragic 59.7% |
| Immigrants | St. Vincent and the Grenadines | 0.0 /100 | #284 | Tragic 59.6% |
| Paiute | 0.0 /100 | #285 | Tragic 59.6% |
| British West Indians | 0.0 /100 | #286 | Tragic 59.5% |
| Sioux | 0.0 /100 | #287 | Tragic 59.4% |
| Blacks/African Americans | 0.0 /100 | #288 | Tragic 59.4% |
| Choctaw | 0.0 /100 | #289 | Tragic 59.3% |
| Ecuadorians | 0.0 /100 | #290 | Tragic 59.3% |
| Creek | 0.0 /100 | #291 | Tragic 59.3% |
| Nicaraguans | 0.0 /100 | #292 | Tragic 59.2% |
| Seminole | 0.0 /100 | #293 | Tragic 59.1% |
| Immigrants | Belize | 0.0 /100 | #294 | Tragic 59.1% |
| Immigrants | Grenada | 0.0 /100 | #295 | Tragic 59.1% |
Demographics Similar to Cree by College, Under 1 year
In terms of college, under 1 year, the demographic groups most similar to Cree are Immigrants from Senegal (63.3%, a difference of 0.050%), Portuguese (63.4%, a difference of 0.090%), Immigrants from Panama (63.4%, a difference of 0.11%), Immigrants from Fiji (63.4%, a difference of 0.11%), and Immigrants from Uruguay (63.4%, a difference of 0.14%).
| Demographics | Rating | Rank | College, Under 1 year |
| Immigrants | Nigeria | 8.8 /100 | #214 | Tragic 63.7% |
| Senegalese | 7.7 /100 | #215 | Tragic 63.6% |
| Hmong | 6.8 /100 | #216 | Tragic 63.5% |
| Immigrants | Uruguay | 5.8 /100 | #217 | Tragic 63.4% |
| Immigrants | Panama | 5.7 /100 | #218 | Tragic 63.4% |
| Immigrants | Fiji | 5.7 /100 | #219 | Tragic 63.4% |
| Portuguese | 5.6 /100 | #220 | Tragic 63.4% |
| Cree | 5.2 /100 | #221 | Tragic 63.3% |
| Immigrants | Senegal | 5.0 /100 | #222 | Tragic 63.3% |
| Immigrants | Costa Rica | 4.5 /100 | #223 | Tragic 63.2% |
| Sub-Saharan Africans | 4.4 /100 | #224 | Tragic 63.2% |
| Immigrants | Peru | 4.0 /100 | #225 | Tragic 63.1% |
| Immigrants | Colombia | 4.0 /100 | #226 | Tragic 63.1% |
| Immigrants | Ghana | 3.7 /100 | #227 | Tragic 63.1% |
| Samoans | 3.3 /100 | #228 | Tragic 63.0% |