Navajo vs Immigrants from Korea GED/Equivalency
COMPARE
Navajo
Immigrants from Korea
GED/Equivalency
GED/Equivalency Comparison
Navajo
Immigrants from Korea
81.5%
GED/EQUIVALENCY
0.0/ 100
METRIC RATING
304th/ 347
METRIC RANK
88.1%
GED/EQUIVALENCY
99.5/ 100
METRIC RATING
50th/ 347
METRIC RANK
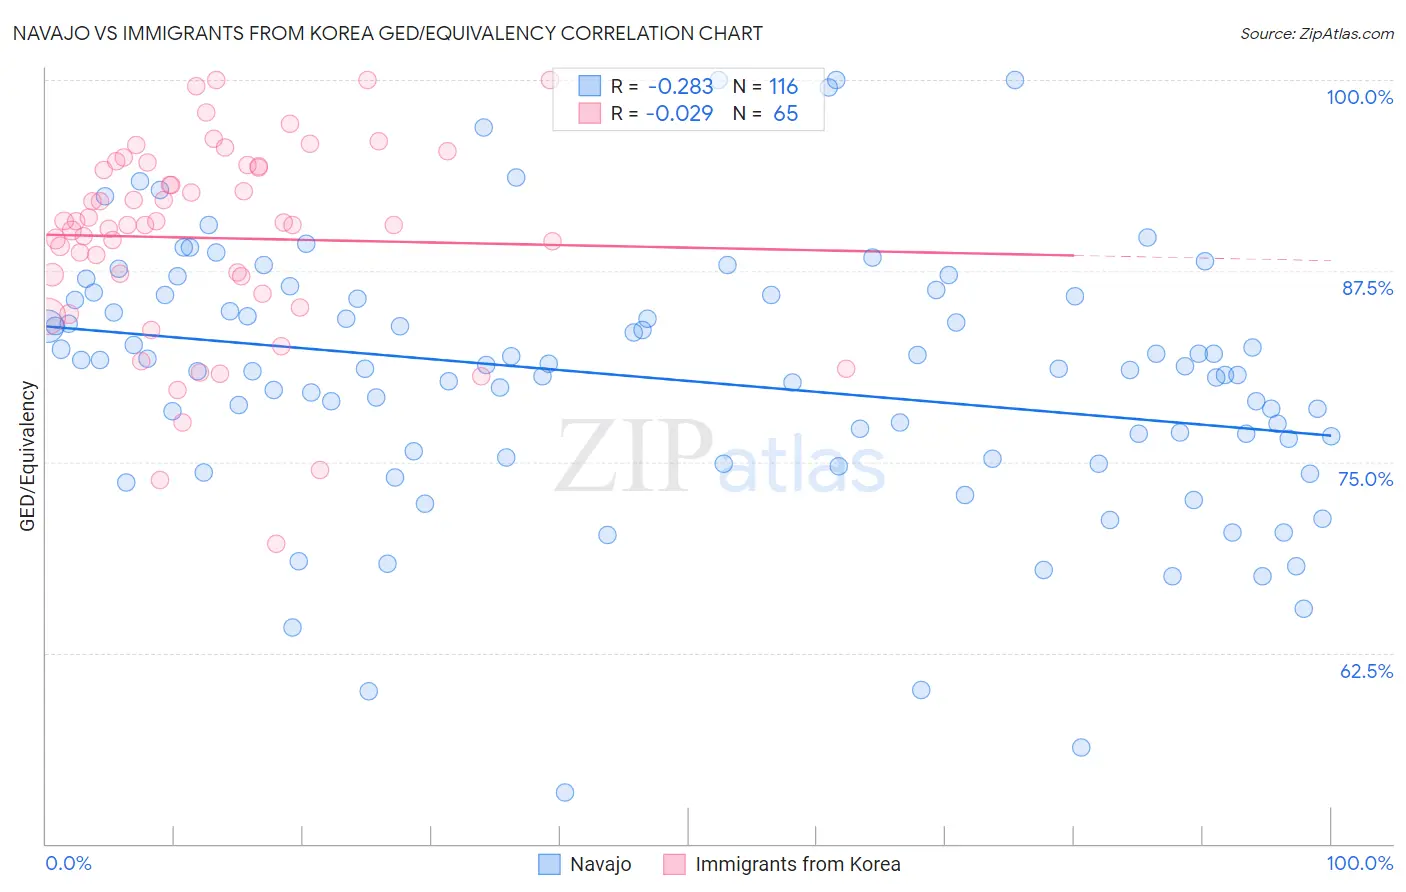
Navajo vs Immigrants from Korea GED/Equivalency Correlation Chart
The statistical analysis conducted on geographies consisting of 224,872,856 people shows a weak negative correlation between the proportion of Navajo and percentage of population with at least ged/equivalency education in the United States with a correlation coefficient (R) of -0.283 and weighted average of 81.5%. Similarly, the statistical analysis conducted on geographies consisting of 416,280,217 people shows no correlation between the proportion of Immigrants from Korea and percentage of population with at least ged/equivalency education in the United States with a correlation coefficient (R) of -0.029 and weighted average of 88.1%, a difference of 8.1%.
GED/Equivalency Correlation Summary
| Measurement | Navajo | Immigrants from Korea |
| Minimum | 53.3% | 69.6% |
| Maximum | 100.0% | 100.0% |
| Range | 46.7% | 30.4% |
| Mean | 80.4% | 89.7% |
| Median | 81.1% | 90.5% |
| Interquartile 25% (IQ1) | 75.5% | 86.6% |
| Interquartile 75% (IQ3) | 85.8% | 94.4% |
| Interquartile Range (IQR) | 10.3% | 7.8% |
| Standard Deviation (Sample) | 8.6% | 6.5% |
| Standard Deviation (Population) | 8.5% | 6.5% |
Similar Demographics by GED/Equivalency
Demographics Similar to Navajo by GED/Equivalency
In terms of ged/equivalency, the demographic groups most similar to Navajo are Immigrants from Haiti (81.6%, a difference of 0.10%), Immigrants from Portugal (81.6%, a difference of 0.10%), Dutch West Indian (81.6%, a difference of 0.14%), Fijian (81.6%, a difference of 0.20%), and Immigrants from Grenada (81.3%, a difference of 0.21%).
| Demographics | Rating | Rank | GED/Equivalency |
| Immigrants | Bangladesh | 0.0 /100 | #297 | Tragic 81.9% |
| Ute | 0.0 /100 | #298 | Tragic 81.8% |
| Ecuadorians | 0.0 /100 | #299 | Tragic 81.7% |
| Fijians | 0.0 /100 | #300 | Tragic 81.6% |
| Dutch West Indians | 0.0 /100 | #301 | Tragic 81.6% |
| Immigrants | Haiti | 0.0 /100 | #302 | Tragic 81.6% |
| Immigrants | Portugal | 0.0 /100 | #303 | Tragic 81.6% |
| Navajo | 0.0 /100 | #304 | Tragic 81.5% |
| Immigrants | Grenada | 0.0 /100 | #305 | Tragic 81.3% |
| Guyanese | 0.0 /100 | #306 | Tragic 81.3% |
| Immigrants | Dominica | 0.0 /100 | #307 | Tragic 81.1% |
| Puerto Ricans | 0.0 /100 | #308 | Tragic 81.1% |
| Immigrants | Ecuador | 0.0 /100 | #309 | Tragic 81.0% |
| Immigrants | Guyana | 0.0 /100 | #310 | Tragic 81.0% |
| Natives/Alaskans | 0.0 /100 | #311 | Tragic 80.9% |
Demographics Similar to Immigrants from Korea by GED/Equivalency
In terms of ged/equivalency, the demographic groups most similar to Immigrants from Korea are Australian (88.1%, a difference of 0.010%), Greek (88.1%, a difference of 0.020%), Immigrants from Latvia (88.1%, a difference of 0.030%), Immigrants from Switzerland (88.1%, a difference of 0.040%), and Czech (88.1%, a difference of 0.050%).
| Demographics | Rating | Rank | GED/Equivalency |
| Immigrants | Scotland | 99.6 /100 | #43 | Exceptional 88.2% |
| Macedonians | 99.5 /100 | #44 | Exceptional 88.1% |
| Czechs | 99.5 /100 | #45 | Exceptional 88.1% |
| Immigrants | Switzerland | 99.5 /100 | #46 | Exceptional 88.1% |
| Immigrants | Latvia | 99.5 /100 | #47 | Exceptional 88.1% |
| Greeks | 99.5 /100 | #48 | Exceptional 88.1% |
| Australians | 99.5 /100 | #49 | Exceptional 88.1% |
| Immigrants | Korea | 99.5 /100 | #50 | Exceptional 88.1% |
| Immigrants | Netherlands | 99.4 /100 | #51 | Exceptional 88.0% |
| Zimbabweans | 99.4 /100 | #52 | Exceptional 88.0% |
| Immigrants | South Africa | 99.4 /100 | #53 | Exceptional 88.0% |
| Soviet Union | 99.4 /100 | #54 | Exceptional 88.0% |
| New Zealanders | 99.4 /100 | #55 | Exceptional 88.0% |
| Immigrants | Denmark | 99.4 /100 | #56 | Exceptional 88.0% |
| Immigrants | Czechoslovakia | 99.3 /100 | #57 | Exceptional 87.9% |