Immigrants from Eastern Asia vs Immigrants from Korea Unemployment Among Ages 30 to 34 years
COMPARE
Immigrants from Eastern Asia
Immigrants from Korea
Unemployment Among Ages 30 to 34 years
Unemployment Among Ages 30 to 34 years Comparison
Immigrants from Eastern Asia
Immigrants from Korea
5.1%
UNEMPLOYMENT AMONG AGES 30 TO 34 YEARS
96.9/ 100
METRIC RATING
64th/ 347
METRIC RANK
5.2%
UNEMPLOYMENT AMONG AGES 30 TO 34 YEARS
94.1/ 100
METRIC RATING
83rd/ 347
METRIC RANK
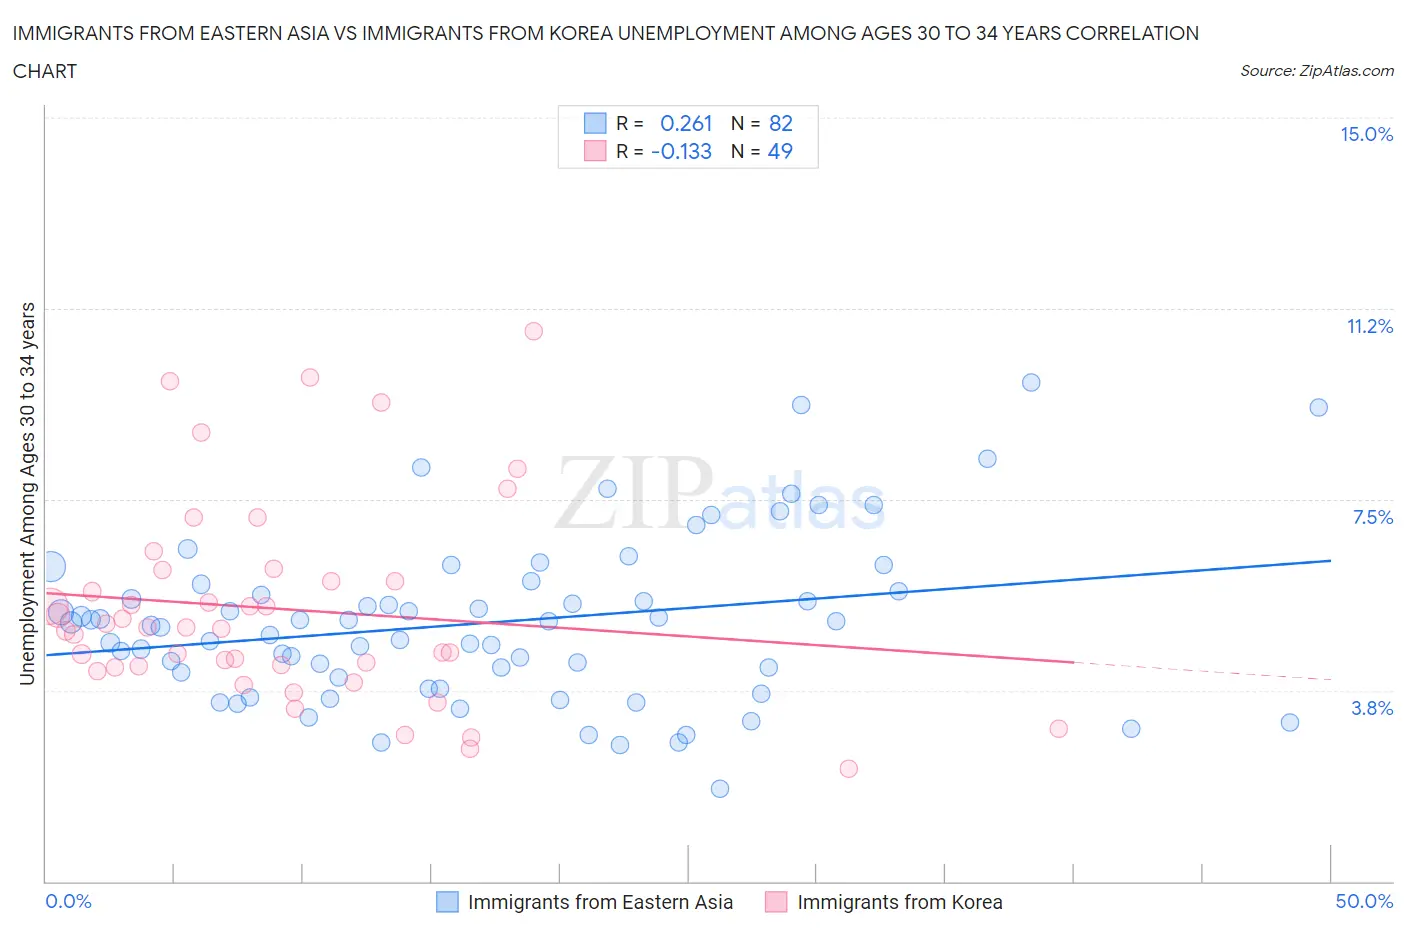
Immigrants from Eastern Asia vs Immigrants from Korea Unemployment Among Ages 30 to 34 years Correlation Chart
The statistical analysis conducted on geographies consisting of 457,725,166 people shows a weak positive correlation between the proportion of Immigrants from Eastern Asia and unemployment rate among population between the ages 30 and 34 in the United States with a correlation coefficient (R) of 0.261 and weighted average of 5.1%. Similarly, the statistical analysis conducted on geographies consisting of 390,390,260 people shows a poor negative correlation between the proportion of Immigrants from Korea and unemployment rate among population between the ages 30 and 34 in the United States with a correlation coefficient (R) of -0.133 and weighted average of 5.2%, a difference of 1.3%.
Unemployment Among Ages 30 to 34 years Correlation Summary
| Measurement | Immigrants from Eastern Asia | Immigrants from Korea |
| Minimum | 1.8% | 2.2% |
| Maximum | 9.8% | 10.8% |
| Range | 8.0% | 8.6% |
| Mean | 5.1% | 5.3% |
| Median | 5.1% | 5.0% |
| Interquartile 25% (IQ1) | 4.0% | 4.2% |
| Interquartile 75% (IQ3) | 5.7% | 6.0% |
| Interquartile Range (IQR) | 1.7% | 1.8% |
| Standard Deviation (Sample) | 1.6% | 2.0% |
| Standard Deviation (Population) | 1.6% | 1.9% |
Demographics Similar to Immigrants from Eastern Asia and Immigrants from Korea by Unemployment Among Ages 30 to 34 years
In terms of unemployment among ages 30 to 34 years, the demographic groups most similar to Immigrants from Eastern Asia are Belgian (5.1%, a difference of 0.020%), Immigrants from Japan (5.1%, a difference of 0.070%), Immigrants from Zimbabwe (5.1%, a difference of 0.14%), Burmese (5.1%, a difference of 0.27%), and Jordanian (5.1%, a difference of 0.28%). Similarly, the demographic groups most similar to Immigrants from Korea are Immigrants from Latvia (5.2%, a difference of 0.030%), Chilean (5.2%, a difference of 0.11%), Immigrants from Indonesia (5.2%, a difference of 0.21%), Immigrants from Lithuania (5.2%, a difference of 0.31%), and Indonesian (5.2%, a difference of 0.36%).
| Demographics | Rating | Rank | Unemployment Among Ages 30 to 34 years |
| Belgians | 97.0 /100 | #63 | Exceptional 5.1% |
| Immigrants | Eastern Asia | 96.9 /100 | #64 | Exceptional 5.1% |
| Immigrants | Japan | 96.8 /100 | #65 | Exceptional 5.1% |
| Immigrants | Zimbabwe | 96.7 /100 | #66 | Exceptional 5.1% |
| Burmese | 96.5 /100 | #67 | Exceptional 5.1% |
| Jordanians | 96.5 /100 | #68 | Exceptional 5.1% |
| Immigrants | Northern Africa | 96.4 /100 | #69 | Exceptional 5.1% |
| Immigrants | Iraq | 96.4 /100 | #70 | Exceptional 5.1% |
| Paraguayans | 96.4 /100 | #71 | Exceptional 5.1% |
| Immigrants | Moldova | 96.4 /100 | #72 | Exceptional 5.1% |
| Slovenes | 96.2 /100 | #73 | Exceptional 5.2% |
| Immigrants | Asia | 96.2 /100 | #74 | Exceptional 5.2% |
| Iranians | 96.0 /100 | #75 | Exceptional 5.2% |
| Scandinavians | 95.6 /100 | #76 | Exceptional 5.2% |
| Uruguayans | 95.4 /100 | #77 | Exceptional 5.2% |
| Indonesians | 95.1 /100 | #78 | Exceptional 5.2% |
| Immigrants | Lithuania | 95.0 /100 | #79 | Exceptional 5.2% |
| Immigrants | Indonesia | 94.7 /100 | #80 | Exceptional 5.2% |
| Chileans | 94.4 /100 | #81 | Exceptional 5.2% |
| Immigrants | Latvia | 94.2 /100 | #82 | Exceptional 5.2% |
| Immigrants | Korea | 94.1 /100 | #83 | Exceptional 5.2% |