Immigrants from Dominican Republic vs Laotian GED/Equivalency
COMPARE
Immigrants from Dominican Republic
Laotian
GED/Equivalency
GED/Equivalency Comparison
Immigrants from Dominican Republic
Laotians
78.0%
GED/EQUIVALENCY
0.0/ 100
METRIC RATING
336th/ 347
METRIC RANK
86.5%
GED/EQUIVALENCY
83.2/ 100
METRIC RATING
141st/ 347
METRIC RANK
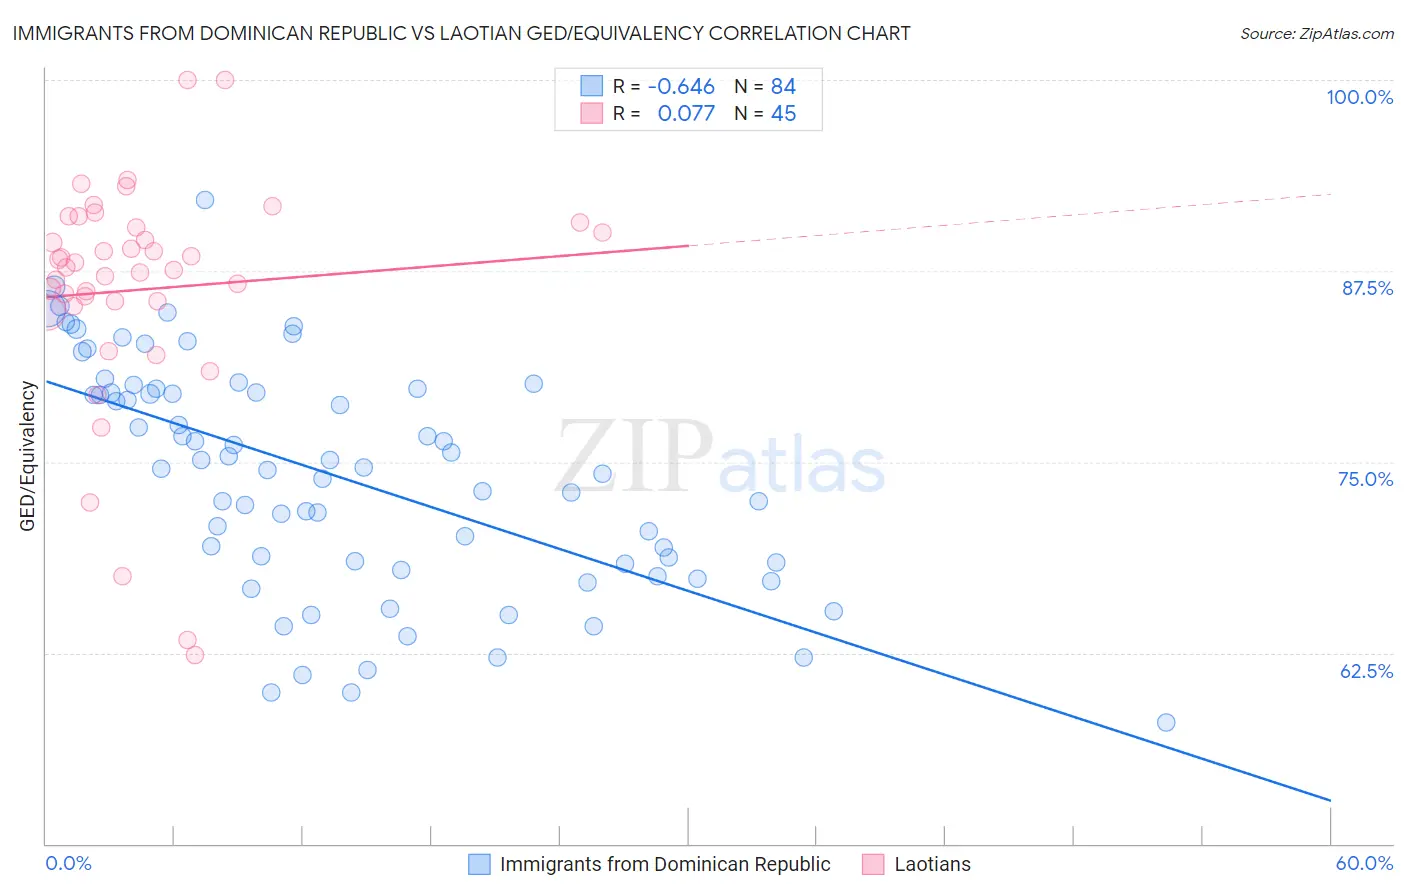
Immigrants from Dominican Republic vs Laotian GED/Equivalency Correlation Chart
The statistical analysis conducted on geographies consisting of 275,144,500 people shows a significant negative correlation between the proportion of Immigrants from Dominican Republic and percentage of population with at least ged/equivalency education in the United States with a correlation coefficient (R) of -0.646 and weighted average of 78.0%. Similarly, the statistical analysis conducted on geographies consisting of 224,856,886 people shows a slight positive correlation between the proportion of Laotians and percentage of population with at least ged/equivalency education in the United States with a correlation coefficient (R) of 0.077 and weighted average of 86.5%, a difference of 10.8%.
GED/Equivalency Correlation Summary
| Measurement | Immigrants from Dominican Republic | Laotian |
| Minimum | 58.0% | 62.4% |
| Maximum | 92.2% | 100.0% |
| Range | 34.2% | 37.6% |
| Mean | 74.1% | 86.3% |
| Median | 74.6% | 87.7% |
| Interquartile 25% (IQ1) | 68.4% | 85.3% |
| Interquartile 75% (IQ3) | 79.6% | 90.5% |
| Interquartile Range (IQR) | 11.3% | 5.1% |
| Standard Deviation (Sample) | 7.5% | 7.7% |
| Standard Deviation (Population) | 7.4% | 7.6% |
Similar Demographics by GED/Equivalency
Demographics Similar to Immigrants from Dominican Republic by GED/Equivalency
In terms of ged/equivalency, the demographic groups most similar to Immigrants from Dominican Republic are Immigrants from Yemen (77.9%, a difference of 0.060%), Immigrants from Guatemala (77.9%, a difference of 0.090%), Immigrants from El Salvador (77.6%, a difference of 0.47%), Immigrants from Latin America (78.5%, a difference of 0.63%), and Tohono O'odham (77.5%, a difference of 0.63%).
| Demographics | Rating | Rank | GED/Equivalency |
| Dominicans | 0.0 /100 | #329 | Tragic 79.1% |
| Immigrants | Cabo Verde | 0.0 /100 | #330 | Tragic 78.9% |
| Immigrants | Honduras | 0.0 /100 | #331 | Tragic 78.7% |
| Immigrants | Azores | 0.0 /100 | #332 | Tragic 78.7% |
| Salvadorans | 0.0 /100 | #333 | Tragic 78.6% |
| Guatemalans | 0.0 /100 | #334 | Tragic 78.5% |
| Immigrants | Latin America | 0.0 /100 | #335 | Tragic 78.5% |
| Immigrants | Dominican Republic | 0.0 /100 | #336 | Tragic 78.0% |
| Immigrants | Yemen | 0.0 /100 | #337 | Tragic 77.9% |
| Immigrants | Guatemala | 0.0 /100 | #338 | Tragic 77.9% |
| Immigrants | El Salvador | 0.0 /100 | #339 | Tragic 77.6% |
| Tohono O'odham | 0.0 /100 | #340 | Tragic 77.5% |
| Mexicans | 0.0 /100 | #341 | Tragic 77.4% |
| Pima | 0.0 /100 | #342 | Tragic 76.4% |
| Immigrants | Central America | 0.0 /100 | #343 | Tragic 76.4% |
Demographics Similar to Laotians by GED/Equivalency
In terms of ged/equivalency, the demographic groups most similar to Laotians are Paraguayan (86.5%, a difference of 0.030%), Immigrants from Indonesia (86.4%, a difference of 0.030%), Immigrants from Pakistan (86.4%, a difference of 0.030%), Bolivian (86.4%, a difference of 0.040%), and Immigrants from Malaysia (86.5%, a difference of 0.070%).
| Demographics | Rating | Rank | GED/Equivalency |
| Albanians | 87.7 /100 | #134 | Excellent 86.6% |
| Immigrants | Asia | 87.4 /100 | #135 | Excellent 86.6% |
| Chileans | 86.9 /100 | #136 | Excellent 86.6% |
| Arabs | 86.7 /100 | #137 | Excellent 86.6% |
| Immigrants | Argentina | 86.5 /100 | #138 | Excellent 86.6% |
| Immigrants | Malaysia | 85.0 /100 | #139 | Excellent 86.5% |
| Paraguayans | 84.1 /100 | #140 | Excellent 86.5% |
| Laotians | 83.2 /100 | #141 | Excellent 86.5% |
| Immigrants | Indonesia | 82.4 /100 | #142 | Excellent 86.4% |
| Immigrants | Pakistan | 82.4 /100 | #143 | Excellent 86.4% |
| Bolivians | 82.1 /100 | #144 | Excellent 86.4% |
| Pakistanis | 80.4 /100 | #145 | Excellent 86.4% |
| Basques | 79.5 /100 | #146 | Good 86.4% |
| Immigrants | Northern Africa | 79.3 /100 | #147 | Good 86.3% |
| Immigrants | Poland | 79.3 /100 | #148 | Good 86.3% |