Immigrants from Dominican Republic vs Laotian Bachelor's Degree
COMPARE
Immigrants from Dominican Republic
Laotian
Bachelor's Degree
Bachelor's Degree Comparison
Immigrants from Dominican Republic
Laotians
30.7%
BACHELOR'S DEGREE
0.0/ 100
METRIC RATING
295th/ 347
METRIC RANK
42.0%
BACHELOR'S DEGREE
98.9/ 100
METRIC RATING
90th/ 347
METRIC RANK
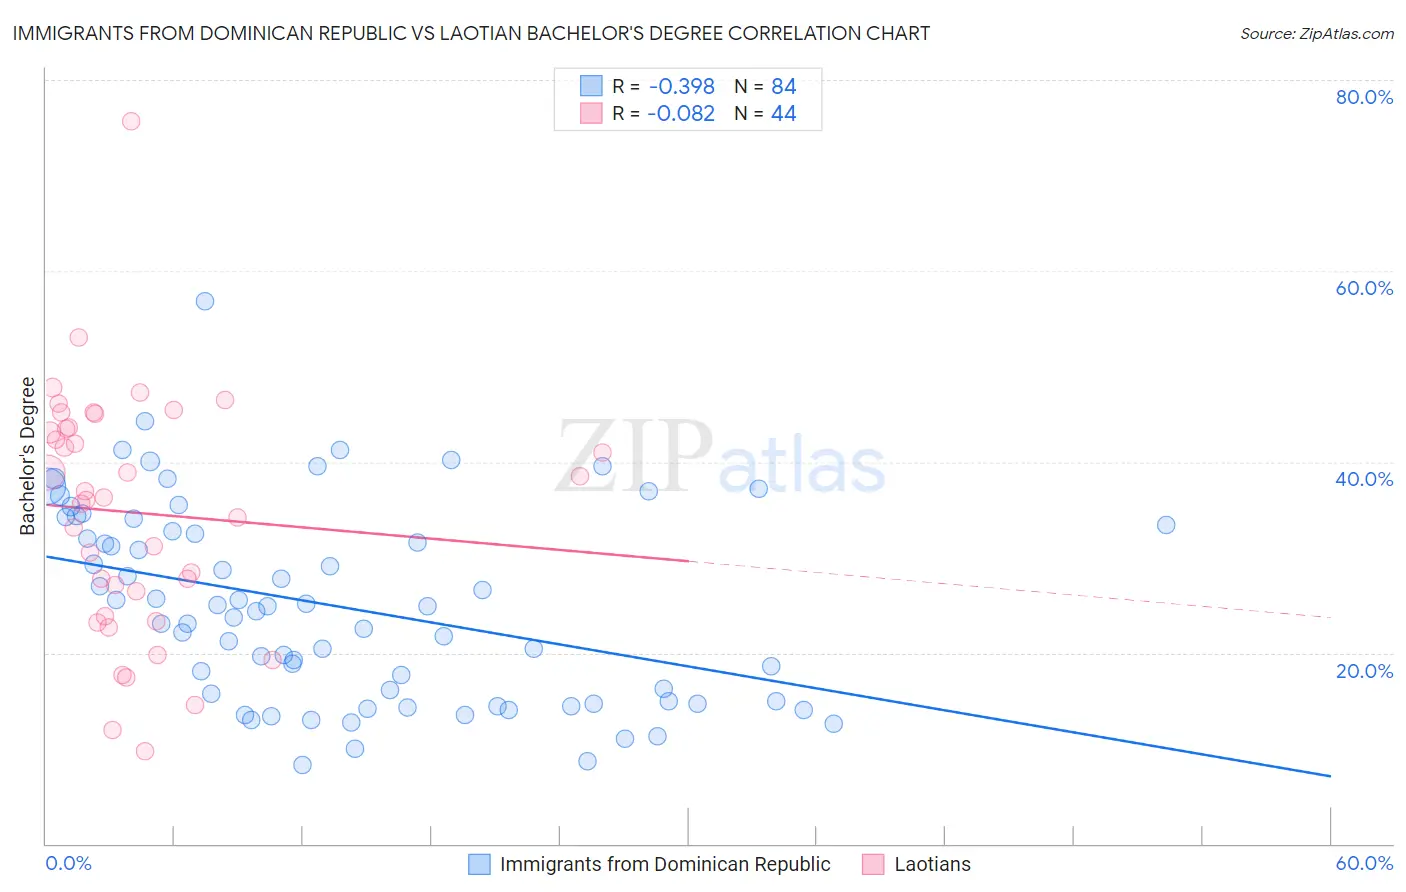
Immigrants from Dominican Republic vs Laotian Bachelor's Degree Correlation Chart
The statistical analysis conducted on geographies consisting of 275,132,010 people shows a mild negative correlation between the proportion of Immigrants from Dominican Republic and percentage of population with at least bachelor's degree education in the United States with a correlation coefficient (R) of -0.398 and weighted average of 30.7%. Similarly, the statistical analysis conducted on geographies consisting of 224,838,887 people shows a slight negative correlation between the proportion of Laotians and percentage of population with at least bachelor's degree education in the United States with a correlation coefficient (R) of -0.082 and weighted average of 42.0%, a difference of 36.8%.
Bachelor's Degree Correlation Summary
| Measurement | Immigrants from Dominican Republic | Laotian |
| Minimum | 8.2% | 9.7% |
| Maximum | 56.8% | 75.7% |
| Range | 48.6% | 66.0% |
| Mean | 24.9% | 34.6% |
| Median | 24.6% | 36.1% |
| Interquartile 25% (IQ1) | 14.9% | 25.1% |
| Interquartile 75% (IQ3) | 33.0% | 43.5% |
| Interquartile Range (IQR) | 18.1% | 18.4% |
| Standard Deviation (Sample) | 10.2% | 12.7% |
| Standard Deviation (Population) | 10.1% | 12.6% |
Similar Demographics by Bachelor's Degree
Demographics Similar to Immigrants from Dominican Republic by Bachelor's Degree
In terms of bachelor's degree, the demographic groups most similar to Immigrants from Dominican Republic are Puget Sound Salish (30.7%, a difference of 0.10%), Immigrants from Haiti (30.6%, a difference of 0.16%), Immigrants from Guatemala (30.8%, a difference of 0.24%), Chippewa (30.6%, a difference of 0.41%), and Cape Verdean (30.9%, a difference of 0.63%).
| Demographics | Rating | Rank | Bachelor's Degree |
| Guatemalans | 0.1 /100 | #288 | Tragic 31.0% |
| Puerto Ricans | 0.1 /100 | #289 | Tragic 31.0% |
| Immigrants | Honduras | 0.1 /100 | #290 | Tragic 30.9% |
| Blacks/African Americans | 0.1 /100 | #291 | Tragic 30.9% |
| Ute | 0.1 /100 | #292 | Tragic 30.9% |
| Cape Verdeans | 0.1 /100 | #293 | Tragic 30.9% |
| Immigrants | Guatemala | 0.0 /100 | #294 | Tragic 30.8% |
| Immigrants | Dominican Republic | 0.0 /100 | #295 | Tragic 30.7% |
| Puget Sound Salish | 0.0 /100 | #296 | Tragic 30.7% |
| Immigrants | Haiti | 0.0 /100 | #297 | Tragic 30.6% |
| Chippewa | 0.0 /100 | #298 | Tragic 30.6% |
| Chickasaw | 0.0 /100 | #299 | Tragic 30.4% |
| Immigrants | Micronesia | 0.0 /100 | #300 | Tragic 30.4% |
| Immigrants | Cuba | 0.0 /100 | #301 | Tragic 30.3% |
| Mexican American Indians | 0.0 /100 | #302 | Tragic 30.2% |
Demographics Similar to Laotians by Bachelor's Degree
In terms of bachelor's degree, the demographic groups most similar to Laotians are Immigrants from Northern Africa (41.9%, a difference of 0.10%), Greek (42.0%, a difference of 0.12%), Immigrants from Western Europe (42.0%, a difference of 0.13%), Maltese (41.9%, a difference of 0.17%), and Carpatho Rusyn (42.1%, a difference of 0.25%).
| Demographics | Rating | Rank | Bachelor's Degree |
| Armenians | 99.2 /100 | #83 | Exceptional 42.3% |
| Immigrants | Western Asia | 99.2 /100 | #84 | Exceptional 42.3% |
| Lithuanians | 99.2 /100 | #85 | Exceptional 42.2% |
| Immigrants | Brazil | 99.2 /100 | #86 | Exceptional 42.2% |
| Carpatho Rusyns | 99.0 /100 | #87 | Exceptional 42.1% |
| Immigrants | Western Europe | 99.0 /100 | #88 | Exceptional 42.0% |
| Greeks | 99.0 /100 | #89 | Exceptional 42.0% |
| Laotians | 98.9 /100 | #90 | Exceptional 42.0% |
| Immigrants | Northern Africa | 98.9 /100 | #91 | Exceptional 41.9% |
| Maltese | 98.8 /100 | #92 | Exceptional 41.9% |
| Immigrants | Canada | 98.6 /100 | #93 | Exceptional 41.7% |
| Immigrants | Nepal | 98.6 /100 | #94 | Exceptional 41.7% |
| Immigrants | North America | 98.5 /100 | #95 | Exceptional 41.7% |
| Immigrants | Moldova | 98.4 /100 | #96 | Exceptional 41.6% |
| Romanians | 98.4 /100 | #97 | Exceptional 41.6% |