Japanese vs Laotian GED/Equivalency
COMPARE
Japanese
Laotian
GED/Equivalency
GED/Equivalency Comparison
Japanese
Laotians
82.4%
GED/EQUIVALENCY
0.0/ 100
METRIC RATING
287th/ 347
METRIC RANK
86.5%
GED/EQUIVALENCY
83.2/ 100
METRIC RATING
141st/ 347
METRIC RANK
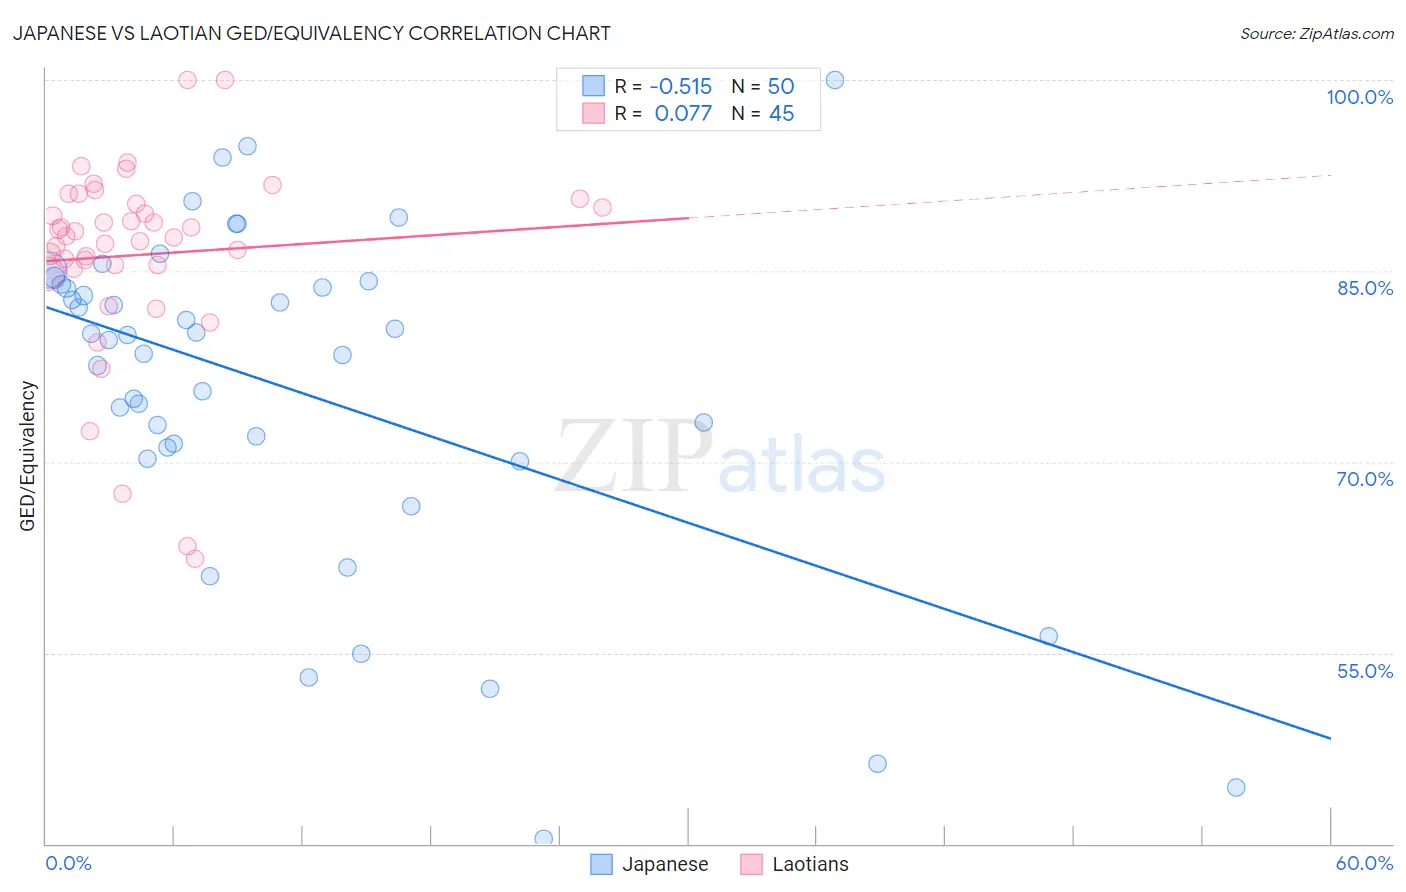
Japanese vs Laotian GED/Equivalency Correlation Chart
The statistical analysis conducted on geographies consisting of 249,183,224 people shows a substantial negative correlation between the proportion of Japanese and percentage of population with at least ged/equivalency education in the United States with a correlation coefficient (R) of -0.515 and weighted average of 82.4%. Similarly, the statistical analysis conducted on geographies consisting of 224,856,886 people shows a slight positive correlation between the proportion of Laotians and percentage of population with at least ged/equivalency education in the United States with a correlation coefficient (R) of 0.077 and weighted average of 86.5%, a difference of 5.0%.
GED/Equivalency Correlation Summary
| Measurement | Japanese | Laotian |
| Minimum | 40.4% | 62.4% |
| Maximum | 100.0% | 100.0% |
| Range | 59.6% | 37.6% |
| Mean | 75.8% | 86.3% |
| Median | 79.8% | 87.7% |
| Interquartile 25% (IQ1) | 71.1% | 85.3% |
| Interquartile 75% (IQ3) | 83.9% | 90.5% |
| Interquartile Range (IQR) | 12.8% | 5.1% |
| Standard Deviation (Sample) | 13.3% | 7.7% |
| Standard Deviation (Population) | 13.1% | 7.6% |
Similar Demographics by GED/Equivalency
Demographics Similar to Japanese by GED/Equivalency
In terms of ged/equivalency, the demographic groups most similar to Japanese are Immigrants from West Indies (82.4%, a difference of 0.020%), Cajun (82.4%, a difference of 0.040%), Immigrants from Barbados (82.4%, a difference of 0.070%), Pueblo (82.3%, a difference of 0.10%), and Immigrants from Cambodia (82.2%, a difference of 0.18%).
| Demographics | Rating | Rank | GED/Equivalency |
| Cheyenne | 0.1 /100 | #280 | Tragic 82.7% |
| Sioux | 0.1 /100 | #281 | Tragic 82.6% |
| Immigrants | Immigrants | 0.1 /100 | #282 | Tragic 82.6% |
| Indonesians | 0.1 /100 | #283 | Tragic 82.5% |
| Immigrants | Barbados | 0.1 /100 | #284 | Tragic 82.4% |
| Cajuns | 0.0 /100 | #285 | Tragic 82.4% |
| Immigrants | West Indies | 0.0 /100 | #286 | Tragic 82.4% |
| Japanese | 0.0 /100 | #287 | Tragic 82.4% |
| Pueblo | 0.0 /100 | #288 | Tragic 82.3% |
| Immigrants | Cambodia | 0.0 /100 | #289 | Tragic 82.2% |
| Haitians | 0.0 /100 | #290 | Tragic 82.1% |
| Cubans | 0.0 /100 | #291 | Tragic 82.0% |
| Paiute | 0.0 /100 | #292 | Tragic 82.0% |
| British West Indians | 0.0 /100 | #293 | Tragic 82.0% |
| Immigrants | St. Vincent and the Grenadines | 0.0 /100 | #294 | Tragic 82.0% |
Demographics Similar to Laotians by GED/Equivalency
In terms of ged/equivalency, the demographic groups most similar to Laotians are Paraguayan (86.5%, a difference of 0.030%), Immigrants from Indonesia (86.4%, a difference of 0.030%), Immigrants from Pakistan (86.4%, a difference of 0.030%), Bolivian (86.4%, a difference of 0.040%), and Immigrants from Malaysia (86.5%, a difference of 0.070%).
| Demographics | Rating | Rank | GED/Equivalency |
| Albanians | 87.7 /100 | #134 | Excellent 86.6% |
| Immigrants | Asia | 87.4 /100 | #135 | Excellent 86.6% |
| Chileans | 86.9 /100 | #136 | Excellent 86.6% |
| Arabs | 86.7 /100 | #137 | Excellent 86.6% |
| Immigrants | Argentina | 86.5 /100 | #138 | Excellent 86.6% |
| Immigrants | Malaysia | 85.0 /100 | #139 | Excellent 86.5% |
| Paraguayans | 84.1 /100 | #140 | Excellent 86.5% |
| Laotians | 83.2 /100 | #141 | Excellent 86.5% |
| Immigrants | Indonesia | 82.4 /100 | #142 | Excellent 86.4% |
| Immigrants | Pakistan | 82.4 /100 | #143 | Excellent 86.4% |
| Bolivians | 82.1 /100 | #144 | Excellent 86.4% |
| Pakistanis | 80.4 /100 | #145 | Excellent 86.4% |
| Basques | 79.5 /100 | #146 | Good 86.4% |
| Immigrants | Northern Africa | 79.3 /100 | #147 | Good 86.3% |
| Immigrants | Poland | 79.3 /100 | #148 | Good 86.3% |