Immigrants from Colombia vs Immigrants from Croatia Married-couple Households
COMPARE
Immigrants from Colombia
Immigrants from Croatia
Married-couple Households
Married-couple Households Comparison
Immigrants from Colombia
Immigrants from Croatia
46.4%
MARRIED-COUPLE HOUSEHOLDS
46.1/ 100
METRIC RATING
175th/ 347
METRIC RANK
46.7%
MARRIED-COUPLE HOUSEHOLDS
64.2/ 100
METRIC RATING
167th/ 347
METRIC RANK
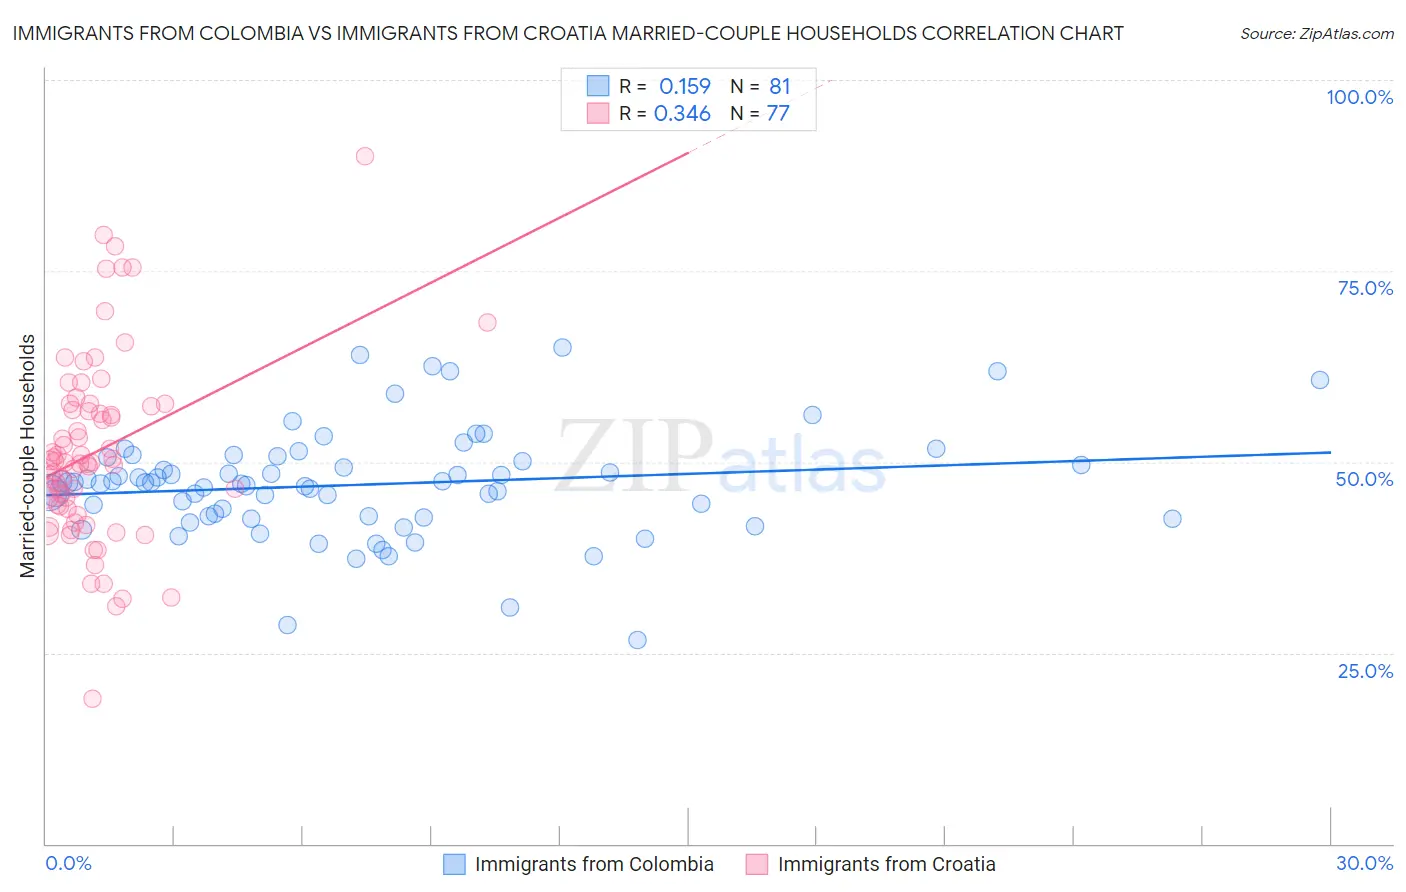
Immigrants from Colombia vs Immigrants from Croatia Married-couple Households Correlation Chart
The statistical analysis conducted on geographies consisting of 378,499,712 people shows a poor positive correlation between the proportion of Immigrants from Colombia and percentage of married-couple family households in the United States with a correlation coefficient (R) of 0.159 and weighted average of 46.4%. Similarly, the statistical analysis conducted on geographies consisting of 132,566,764 people shows a mild positive correlation between the proportion of Immigrants from Croatia and percentage of married-couple family households in the United States with a correlation coefficient (R) of 0.346 and weighted average of 46.7%, a difference of 0.70%.
Married-couple Households Correlation Summary
| Measurement | Immigrants from Colombia | Immigrants from Croatia |
| Minimum | 26.7% | 18.9% |
| Maximum | 64.9% | 90.0% |
| Range | 38.2% | 71.1% |
| Mean | 47.0% | 51.4% |
| Median | 47.3% | 50.0% |
| Interquartile 25% (IQ1) | 42.8% | 44.0% |
| Interquartile 75% (IQ3) | 50.4% | 57.4% |
| Interquartile Range (IQR) | 7.5% | 13.4% |
| Standard Deviation (Sample) | 7.1% | 12.2% |
| Standard Deviation (Population) | 7.1% | 12.1% |
Demographics Similar to Immigrants from Colombia and Immigrants from Croatia by Married-couple Households
In terms of married-couple households, the demographic groups most similar to Immigrants from Colombia are Cajun (46.4%, a difference of 0.030%), Immigrants (46.3%, a difference of 0.090%), Immigrants from Costa Rica (46.3%, a difference of 0.10%), Immigrants from Zimbabwe (46.3%, a difference of 0.12%), and Immigrants from Mexico (46.4%, a difference of 0.15%). Similarly, the demographic groups most similar to Immigrants from Croatia are Cherokee (46.7%, a difference of 0.060%), Israeli (46.7%, a difference of 0.080%), Spanish American Indian (46.6%, a difference of 0.19%), Immigrants from Kazakhstan (46.8%, a difference of 0.24%), and Immigrants from Southern Europe (46.8%, a difference of 0.24%).
| Demographics | Rating | Rank | Married-couple Households |
| Delaware | 71.2 /100 | #161 | Good 46.8% |
| Colombians | 71.0 /100 | #162 | Good 46.8% |
| Immigrants | Turkey | 70.2 /100 | #163 | Good 46.8% |
| Immigrants | Kazakhstan | 70.0 /100 | #164 | Good 46.8% |
| Immigrants | Southern Europe | 69.9 /100 | #165 | Good 46.8% |
| Cherokee | 65.7 /100 | #166 | Good 46.7% |
| Immigrants | Croatia | 64.2 /100 | #167 | Good 46.7% |
| Israelis | 62.3 /100 | #168 | Good 46.7% |
| Spanish American Indians | 59.4 /100 | #169 | Average 46.6% |
| South Americans | 58.0 /100 | #170 | Average 46.6% |
| Immigrants | Chile | 55.7 /100 | #171 | Average 46.5% |
| Immigrants | Australia | 54.6 /100 | #172 | Average 46.5% |
| Immigrants | Norway | 52.0 /100 | #173 | Average 46.5% |
| Immigrants | Mexico | 50.0 /100 | #174 | Average 46.4% |
| Immigrants | Colombia | 46.1 /100 | #175 | Average 46.4% |
| Cajuns | 45.2 /100 | #176 | Average 46.4% |
| Immigrants | Immigrants | 43.8 /100 | #177 | Average 46.3% |
| Immigrants | Costa Rica | 43.4 /100 | #178 | Average 46.3% |
| Immigrants | Zimbabwe | 43.0 /100 | #179 | Average 46.3% |
| Mongolians | 42.0 /100 | #180 | Average 46.3% |
| Malaysians | 41.8 /100 | #181 | Average 46.3% |