Immigrants from Colombia vs Cheyenne College, 1 year or more
COMPARE
Immigrants from Colombia
Cheyenne
College, 1 year or more
College, 1 year or more Comparison
Immigrants from Colombia
Cheyenne
57.8%
COLLEGE, 1 YEAR OR MORE
11.6/ 100
METRIC RATING
214th/ 347
METRIC RANK
54.1%
COLLEGE, 1 YEAR OR MORE
0.1/ 100
METRIC RATING
280th/ 347
METRIC RANK
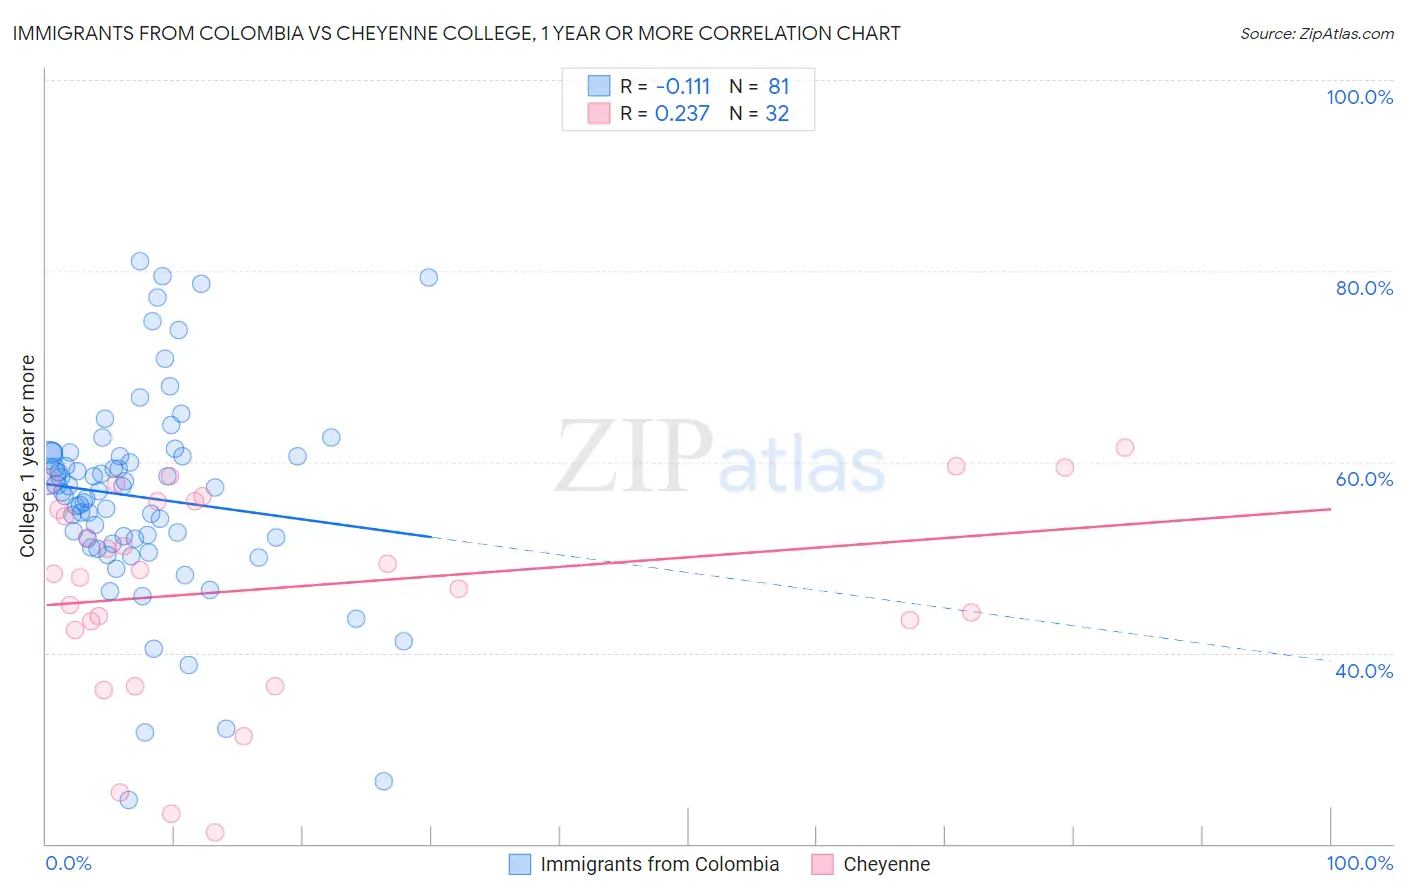
Immigrants from Colombia vs Cheyenne College, 1 year or more Correlation Chart
The statistical analysis conducted on geographies consisting of 378,687,641 people shows a poor negative correlation between the proportion of Immigrants from Colombia and percentage of population with at least college, 1 year or more education in the United States with a correlation coefficient (R) of -0.111 and weighted average of 57.8%. Similarly, the statistical analysis conducted on geographies consisting of 80,719,187 people shows a weak positive correlation between the proportion of Cheyenne and percentage of population with at least college, 1 year or more education in the United States with a correlation coefficient (R) of 0.237 and weighted average of 54.1%, a difference of 6.8%.
College, 1 year or more Correlation Summary
| Measurement | Immigrants from Colombia | Cheyenne |
| Minimum | 24.6% | 21.1% |
| Maximum | 81.0% | 61.5% |
| Range | 56.4% | 40.3% |
| Mean | 56.3% | 46.8% |
| Median | 57.0% | 48.5% |
| Interquartile 25% (IQ1) | 51.7% | 42.9% |
| Interquartile 75% (IQ3) | 60.7% | 55.9% |
| Interquartile Range (IQR) | 9.0% | 13.0% |
| Standard Deviation (Sample) | 10.7% | 10.9% |
| Standard Deviation (Population) | 10.6% | 10.7% |
Similar Demographics by College, 1 year or more
Demographics Similar to Immigrants from Colombia by College, 1 year or more
In terms of college, 1 year or more, the demographic groups most similar to Immigrants from Colombia are Tongan (57.8%, a difference of 0.0%), Immigrants from Senegal (57.8%, a difference of 0.030%), French Canadian (57.8%, a difference of 0.030%), Immigrants from Peru (57.7%, a difference of 0.14%), and Immigrants from Nigeria (57.9%, a difference of 0.21%).
| Demographics | Rating | Rank | College, 1 year or more |
| Senegalese | 16.9 /100 | #207 | Poor 58.2% |
| Immigrants | Uruguay | 15.2 /100 | #208 | Poor 58.1% |
| Immigrants | Middle Africa | 14.0 /100 | #209 | Poor 58.0% |
| Tsimshian | 13.5 /100 | #210 | Poor 57.9% |
| Immigrants | Nigeria | 13.3 /100 | #211 | Poor 57.9% |
| Immigrants | Senegal | 11.8 /100 | #212 | Poor 57.8% |
| French Canadians | 11.8 /100 | #213 | Poor 57.8% |
| Immigrants | Colombia | 11.6 /100 | #214 | Poor 57.8% |
| Tongans | 11.6 /100 | #215 | Poor 57.8% |
| Immigrants | Peru | 10.6 /100 | #216 | Poor 57.7% |
| Immigrants | Panama | 9.1 /100 | #217 | Tragic 57.6% |
| Native Hawaiians | 9.0 /100 | #218 | Tragic 57.6% |
| Whites/Caucasians | 8.7 /100 | #219 | Tragic 57.6% |
| Immigrants | Costa Rica | 8.0 /100 | #220 | Tragic 57.5% |
| Immigrants | Ghana | 7.7 /100 | #221 | Tragic 57.4% |
Demographics Similar to Cheyenne by College, 1 year or more
In terms of college, 1 year or more, the demographic groups most similar to Cheyenne are Colville (54.1%, a difference of 0.010%), Guyanese (54.1%, a difference of 0.050%), Arapaho (54.1%, a difference of 0.060%), Immigrants from Jamaica (54.2%, a difference of 0.070%), and Ecuadorian (54.3%, a difference of 0.39%).
| Demographics | Rating | Rank | College, 1 year or more |
| Immigrants | Grenada | 0.2 /100 | #273 | Tragic 54.4% |
| Belizeans | 0.2 /100 | #274 | Tragic 54.4% |
| Americans | 0.2 /100 | #275 | Tragic 54.4% |
| Shoshone | 0.2 /100 | #276 | Tragic 54.3% |
| Ecuadorians | 0.2 /100 | #277 | Tragic 54.3% |
| Immigrants | Jamaica | 0.1 /100 | #278 | Tragic 54.2% |
| Arapaho | 0.1 /100 | #279 | Tragic 54.1% |
| Cheyenne | 0.1 /100 | #280 | Tragic 54.1% |
| Colville | 0.1 /100 | #281 | Tragic 54.1% |
| Guyanese | 0.1 /100 | #282 | Tragic 54.1% |
| Nicaraguans | 0.1 /100 | #283 | Tragic 53.9% |
| Ute | 0.1 /100 | #284 | Tragic 53.8% |
| Immigrants | Guyana | 0.1 /100 | #285 | Tragic 53.5% |
| Central American Indians | 0.1 /100 | #286 | Tragic 53.5% |
| Immigrants | Belize | 0.1 /100 | #287 | Tragic 53.5% |