Choctaw vs Cheyenne College, 1 year or more
COMPARE
Choctaw
Cheyenne
College, 1 year or more
College, 1 year or more Comparison
Choctaw
Cheyenne
52.3%
COLLEGE, 1 YEAR OR MORE
0.0/ 100
METRIC RATING
300th/ 347
METRIC RANK
54.1%
COLLEGE, 1 YEAR OR MORE
0.1/ 100
METRIC RATING
280th/ 347
METRIC RANK
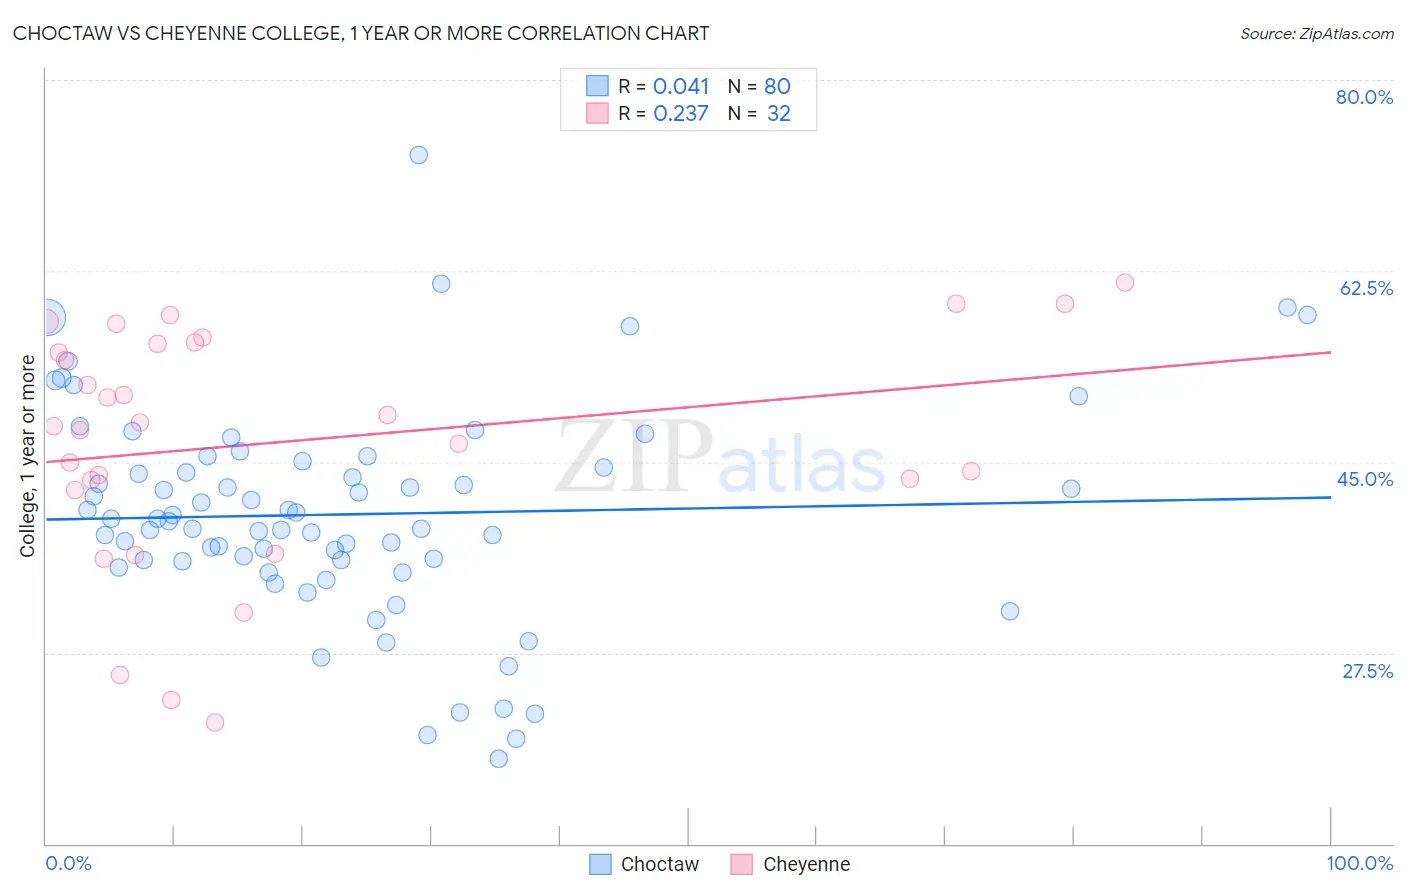
Choctaw vs Cheyenne College, 1 year or more Correlation Chart
The statistical analysis conducted on geographies consisting of 269,741,564 people shows no correlation between the proportion of Choctaw and percentage of population with at least college, 1 year or more education in the United States with a correlation coefficient (R) of 0.041 and weighted average of 52.3%. Similarly, the statistical analysis conducted on geographies consisting of 80,719,187 people shows a weak positive correlation between the proportion of Cheyenne and percentage of population with at least college, 1 year or more education in the United States with a correlation coefficient (R) of 0.237 and weighted average of 54.1%, a difference of 3.4%.
College, 1 year or more Correlation Summary
| Measurement | Choctaw | Cheyenne |
| Minimum | 17.8% | 21.1% |
| Maximum | 73.1% | 61.5% |
| Range | 55.3% | 40.3% |
| Mean | 40.2% | 46.8% |
| Median | 39.7% | 48.5% |
| Interquartile 25% (IQ1) | 35.9% | 42.9% |
| Interquartile 75% (IQ3) | 44.7% | 55.9% |
| Interquartile Range (IQR) | 8.8% | 13.0% |
| Standard Deviation (Sample) | 9.9% | 10.9% |
| Standard Deviation (Population) | 9.8% | 10.7% |
Demographics Similar to Choctaw and Cheyenne by College, 1 year or more
In terms of college, 1 year or more, the demographic groups most similar to Choctaw are Immigrants from Nicaragua (52.4%, a difference of 0.040%), Immigrants from Dominica (52.5%, a difference of 0.38%), Paiute (52.9%, a difference of 0.98%), Sioux (53.0%, a difference of 1.3%), and Yaqui (53.2%, a difference of 1.6%). Similarly, the demographic groups most similar to Cheyenne are Colville (54.1%, a difference of 0.010%), Guyanese (54.1%, a difference of 0.050%), Nicaraguan (53.9%, a difference of 0.42%), Ute (53.8%, a difference of 0.59%), and Immigrants from Guyana (53.5%, a difference of 1.1%).
| Demographics | Rating | Rank | College, 1 year or more |
| Cheyenne | 0.1 /100 | #280 | Tragic 54.1% |
| Colville | 0.1 /100 | #281 | Tragic 54.1% |
| Guyanese | 0.1 /100 | #282 | Tragic 54.1% |
| Nicaraguans | 0.1 /100 | #283 | Tragic 53.9% |
| Ute | 0.1 /100 | #284 | Tragic 53.8% |
| Immigrants | Guyana | 0.1 /100 | #285 | Tragic 53.5% |
| Central American Indians | 0.1 /100 | #286 | Tragic 53.5% |
| Immigrants | Belize | 0.1 /100 | #287 | Tragic 53.5% |
| Alaska Natives | 0.0 /100 | #288 | Tragic 53.4% |
| Immigrants | Ecuador | 0.0 /100 | #289 | Tragic 53.4% |
| Alaskan Athabascans | 0.0 /100 | #290 | Tragic 53.4% |
| Cubans | 0.0 /100 | #291 | Tragic 53.4% |
| Chickasaw | 0.0 /100 | #292 | Tragic 53.3% |
| Blacks/African Americans | 0.0 /100 | #293 | Tragic 53.3% |
| Cherokee | 0.0 /100 | #294 | Tragic 53.2% |
| Yaqui | 0.0 /100 | #295 | Tragic 53.2% |
| Sioux | 0.0 /100 | #296 | Tragic 53.0% |
| Paiute | 0.0 /100 | #297 | Tragic 52.9% |
| Immigrants | Dominica | 0.0 /100 | #298 | Tragic 52.5% |
| Immigrants | Nicaragua | 0.0 /100 | #299 | Tragic 52.4% |
| Choctaw | 0.0 /100 | #300 | Tragic 52.3% |