Pueblo vs Cheyenne College, 1 year or more
COMPARE
Pueblo
Cheyenne
College, 1 year or more
College, 1 year or more Comparison
Pueblo
Cheyenne
51.5%
COLLEGE, 1 YEAR OR MORE
0.0/ 100
METRIC RATING
312th/ 347
METRIC RANK
54.1%
COLLEGE, 1 YEAR OR MORE
0.1/ 100
METRIC RATING
280th/ 347
METRIC RANK
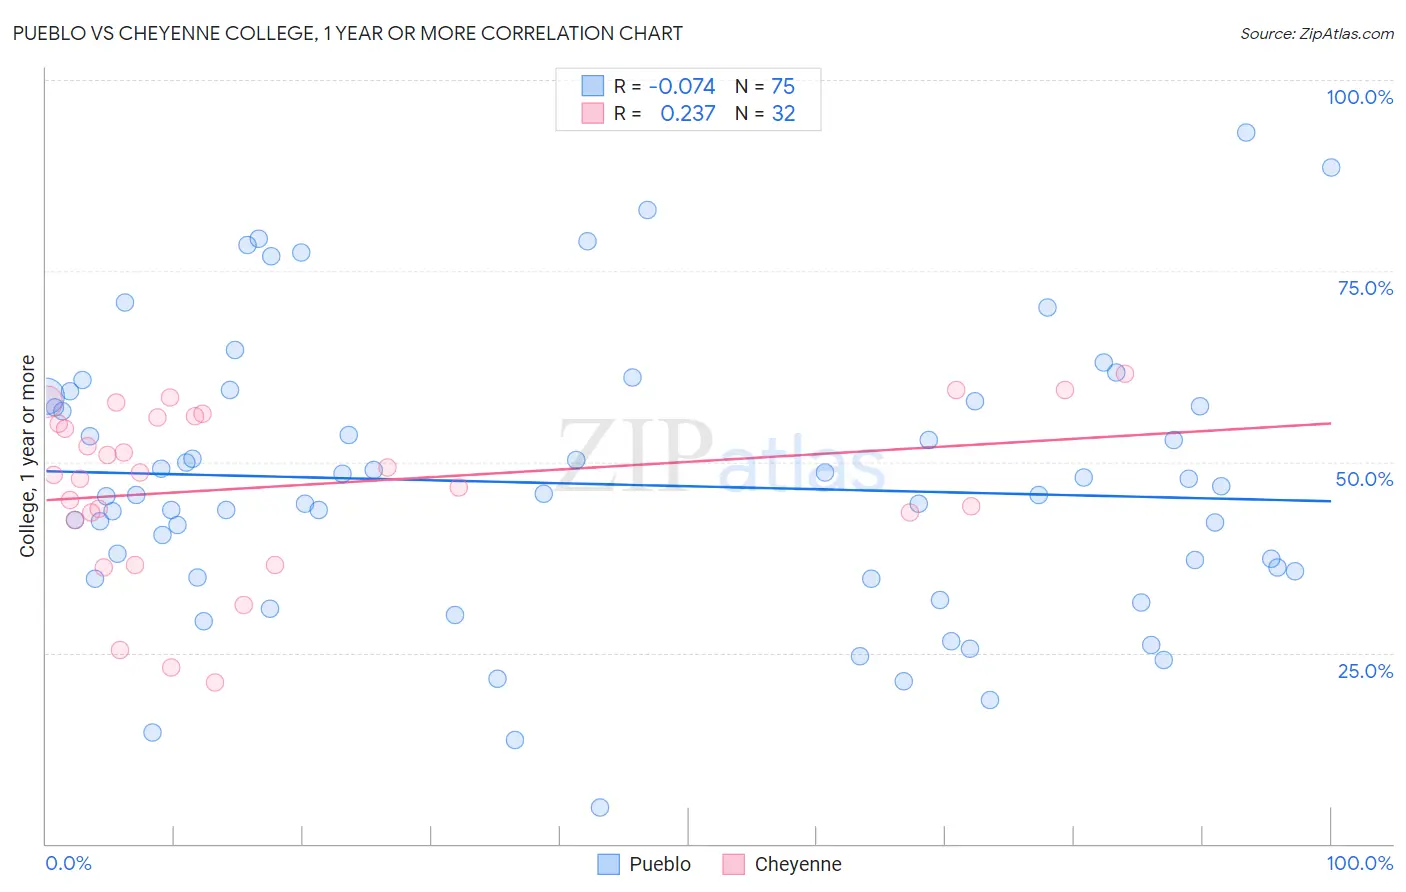
Pueblo vs Cheyenne College, 1 year or more Correlation Chart
The statistical analysis conducted on geographies consisting of 120,087,269 people shows a slight negative correlation between the proportion of Pueblo and percentage of population with at least college, 1 year or more education in the United States with a correlation coefficient (R) of -0.074 and weighted average of 51.5%. Similarly, the statistical analysis conducted on geographies consisting of 80,719,187 people shows a weak positive correlation between the proportion of Cheyenne and percentage of population with at least college, 1 year or more education in the United States with a correlation coefficient (R) of 0.237 and weighted average of 54.1%, a difference of 5.1%.
College, 1 year or more Correlation Summary
| Measurement | Pueblo | Cheyenne |
| Minimum | 4.8% | 21.1% |
| Maximum | 93.1% | 61.5% |
| Range | 88.3% | 40.3% |
| Mean | 47.1% | 46.8% |
| Median | 45.6% | 48.5% |
| Interquartile 25% (IQ1) | 34.9% | 42.9% |
| Interquartile 75% (IQ3) | 57.9% | 55.9% |
| Interquartile Range (IQR) | 23.0% | 13.0% |
| Standard Deviation (Sample) | 18.1% | 10.9% |
| Standard Deviation (Population) | 18.0% | 10.7% |
Similar Demographics by College, 1 year or more
Demographics Similar to Pueblo by College, 1 year or more
In terms of college, 1 year or more, the demographic groups most similar to Pueblo are Immigrants from Haiti (51.5%, a difference of 0.040%), Immigrants from Caribbean (51.4%, a difference of 0.13%), Honduran (51.6%, a difference of 0.20%), Fijian (51.3%, a difference of 0.35%), and Guatemalan (51.2%, a difference of 0.58%).
| Demographics | Rating | Rank | College, 1 year or more |
| Seminole | 0.0 /100 | #305 | Tragic 52.1% |
| Mexican American Indians | 0.0 /100 | #306 | Tragic 51.9% |
| Immigrants | Portugal | 0.0 /100 | #307 | Tragic 51.9% |
| Salvadorans | 0.0 /100 | #308 | Tragic 51.8% |
| Apache | 0.0 /100 | #309 | Tragic 51.8% |
| Hondurans | 0.0 /100 | #310 | Tragic 51.6% |
| Immigrants | Haiti | 0.0 /100 | #311 | Tragic 51.5% |
| Pueblo | 0.0 /100 | #312 | Tragic 51.5% |
| Immigrants | Caribbean | 0.0 /100 | #313 | Tragic 51.4% |
| Fijians | 0.0 /100 | #314 | Tragic 51.3% |
| Guatemalans | 0.0 /100 | #315 | Tragic 51.2% |
| Cajuns | 0.0 /100 | #316 | Tragic 51.2% |
| Hispanics or Latinos | 0.0 /100 | #317 | Tragic 51.1% |
| Immigrants | Honduras | 0.0 /100 | #318 | Tragic 51.0% |
| Immigrants | El Salvador | 0.0 /100 | #319 | Tragic 51.0% |
Demographics Similar to Cheyenne by College, 1 year or more
In terms of college, 1 year or more, the demographic groups most similar to Cheyenne are Colville (54.1%, a difference of 0.010%), Guyanese (54.1%, a difference of 0.050%), Arapaho (54.1%, a difference of 0.060%), Immigrants from Jamaica (54.2%, a difference of 0.070%), and Ecuadorian (54.3%, a difference of 0.39%).
| Demographics | Rating | Rank | College, 1 year or more |
| Immigrants | Grenada | 0.2 /100 | #273 | Tragic 54.4% |
| Belizeans | 0.2 /100 | #274 | Tragic 54.4% |
| Americans | 0.2 /100 | #275 | Tragic 54.4% |
| Shoshone | 0.2 /100 | #276 | Tragic 54.3% |
| Ecuadorians | 0.2 /100 | #277 | Tragic 54.3% |
| Immigrants | Jamaica | 0.1 /100 | #278 | Tragic 54.2% |
| Arapaho | 0.1 /100 | #279 | Tragic 54.1% |
| Cheyenne | 0.1 /100 | #280 | Tragic 54.1% |
| Colville | 0.1 /100 | #281 | Tragic 54.1% |
| Guyanese | 0.1 /100 | #282 | Tragic 54.1% |
| Nicaraguans | 0.1 /100 | #283 | Tragic 53.9% |
| Ute | 0.1 /100 | #284 | Tragic 53.8% |
| Immigrants | Guyana | 0.1 /100 | #285 | Tragic 53.5% |
| Central American Indians | 0.1 /100 | #286 | Tragic 53.5% |
| Immigrants | Belize | 0.1 /100 | #287 | Tragic 53.5% |