Immigrants from Colombia vs Ukrainian College, 1 year or more
COMPARE
Immigrants from Colombia
Ukrainian
College, 1 year or more
College, 1 year or more Comparison
Immigrants from Colombia
Ukrainians
57.8%
COLLEGE, 1 YEAR OR MORE
11.6/ 100
METRIC RATING
214th/ 347
METRIC RANK
61.8%
COLLEGE, 1 YEAR OR MORE
95.2/ 100
METRIC RATING
113th/ 347
METRIC RANK
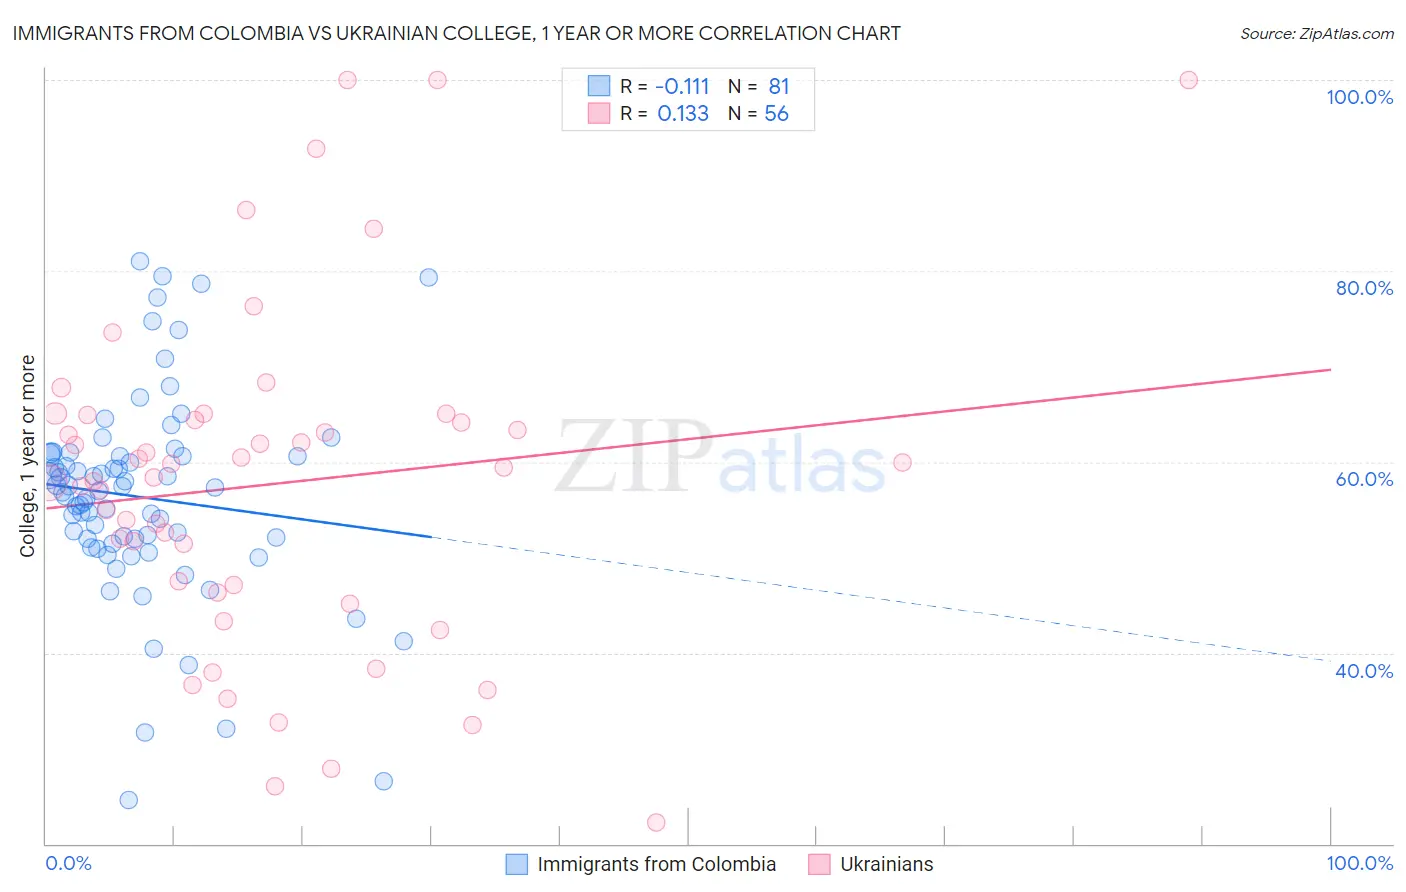
Immigrants from Colombia vs Ukrainian College, 1 year or more Correlation Chart
The statistical analysis conducted on geographies consisting of 378,687,641 people shows a poor negative correlation between the proportion of Immigrants from Colombia and percentage of population with at least college, 1 year or more education in the United States with a correlation coefficient (R) of -0.111 and weighted average of 57.8%. Similarly, the statistical analysis conducted on geographies consisting of 448,693,874 people shows a poor positive correlation between the proportion of Ukrainians and percentage of population with at least college, 1 year or more education in the United States with a correlation coefficient (R) of 0.133 and weighted average of 61.8%, a difference of 6.9%.
College, 1 year or more Correlation Summary
| Measurement | Immigrants from Colombia | Ukrainian |
| Minimum | 24.6% | 22.2% |
| Maximum | 81.0% | 100.0% |
| Range | 56.4% | 77.8% |
| Mean | 56.3% | 57.7% |
| Median | 57.0% | 58.9% |
| Interquartile 25% (IQ1) | 51.7% | 46.7% |
| Interquartile 75% (IQ3) | 60.7% | 64.7% |
| Interquartile Range (IQR) | 9.0% | 17.9% |
| Standard Deviation (Sample) | 10.7% | 17.6% |
| Standard Deviation (Population) | 10.6% | 17.5% |
Similar Demographics by College, 1 year or more
Demographics Similar to Immigrants from Colombia by College, 1 year or more
In terms of college, 1 year or more, the demographic groups most similar to Immigrants from Colombia are Tongan (57.8%, a difference of 0.0%), Immigrants from Senegal (57.8%, a difference of 0.030%), French Canadian (57.8%, a difference of 0.030%), Immigrants from Peru (57.7%, a difference of 0.14%), and Immigrants from Nigeria (57.9%, a difference of 0.21%).
| Demographics | Rating | Rank | College, 1 year or more |
| Senegalese | 16.9 /100 | #207 | Poor 58.2% |
| Immigrants | Uruguay | 15.2 /100 | #208 | Poor 58.1% |
| Immigrants | Middle Africa | 14.0 /100 | #209 | Poor 58.0% |
| Tsimshian | 13.5 /100 | #210 | Poor 57.9% |
| Immigrants | Nigeria | 13.3 /100 | #211 | Poor 57.9% |
| Immigrants | Senegal | 11.8 /100 | #212 | Poor 57.8% |
| French Canadians | 11.8 /100 | #213 | Poor 57.8% |
| Immigrants | Colombia | 11.6 /100 | #214 | Poor 57.8% |
| Tongans | 11.6 /100 | #215 | Poor 57.8% |
| Immigrants | Peru | 10.6 /100 | #216 | Poor 57.7% |
| Immigrants | Panama | 9.1 /100 | #217 | Tragic 57.6% |
| Native Hawaiians | 9.0 /100 | #218 | Tragic 57.6% |
| Whites/Caucasians | 8.7 /100 | #219 | Tragic 57.6% |
| Immigrants | Costa Rica | 8.0 /100 | #220 | Tragic 57.5% |
| Immigrants | Ghana | 7.7 /100 | #221 | Tragic 57.4% |
Demographics Similar to Ukrainians by College, 1 year or more
In terms of college, 1 year or more, the demographic groups most similar to Ukrainians are Austrian (61.8%, a difference of 0.070%), Danish (61.7%, a difference of 0.11%), European (61.8%, a difference of 0.13%), Macedonian (61.8%, a difference of 0.13%), and Immigrants from Northern Africa (61.9%, a difference of 0.14%).
| Demographics | Rating | Rank | College, 1 year or more |
| Palestinians | 96.3 /100 | #106 | Exceptional 62.0% |
| Immigrants | Ukraine | 95.8 /100 | #107 | Exceptional 61.9% |
| Syrians | 95.7 /100 | #108 | Exceptional 61.9% |
| Immigrants | Northern Africa | 95.7 /100 | #109 | Exceptional 61.9% |
| Europeans | 95.6 /100 | #110 | Exceptional 61.8% |
| Macedonians | 95.6 /100 | #111 | Exceptional 61.8% |
| Austrians | 95.4 /100 | #112 | Exceptional 61.8% |
| Ukrainians | 95.2 /100 | #113 | Exceptional 61.8% |
| Danes | 94.8 /100 | #114 | Exceptional 61.7% |
| Norwegians | 94.5 /100 | #115 | Exceptional 61.7% |
| Lebanese | 94.1 /100 | #116 | Exceptional 61.6% |
| Arabs | 93.9 /100 | #117 | Exceptional 61.6% |
| Immigrants | Brazil | 93.9 /100 | #118 | Exceptional 61.6% |
| Assyrians/Chaldeans/Syriacs | 93.3 /100 | #119 | Exceptional 61.5% |
| Pakistanis | 93.2 /100 | #120 | Exceptional 61.5% |