Northern European vs Cheyenne College, 1 year or more
COMPARE
Northern European
Cheyenne
College, 1 year or more
College, 1 year or more Comparison
Northern Europeans
Cheyenne
62.9%
COLLEGE, 1 YEAR OR MORE
98.8/ 100
METRIC RATING
79th/ 347
METRIC RANK
54.1%
COLLEGE, 1 YEAR OR MORE
0.1/ 100
METRIC RATING
280th/ 347
METRIC RANK
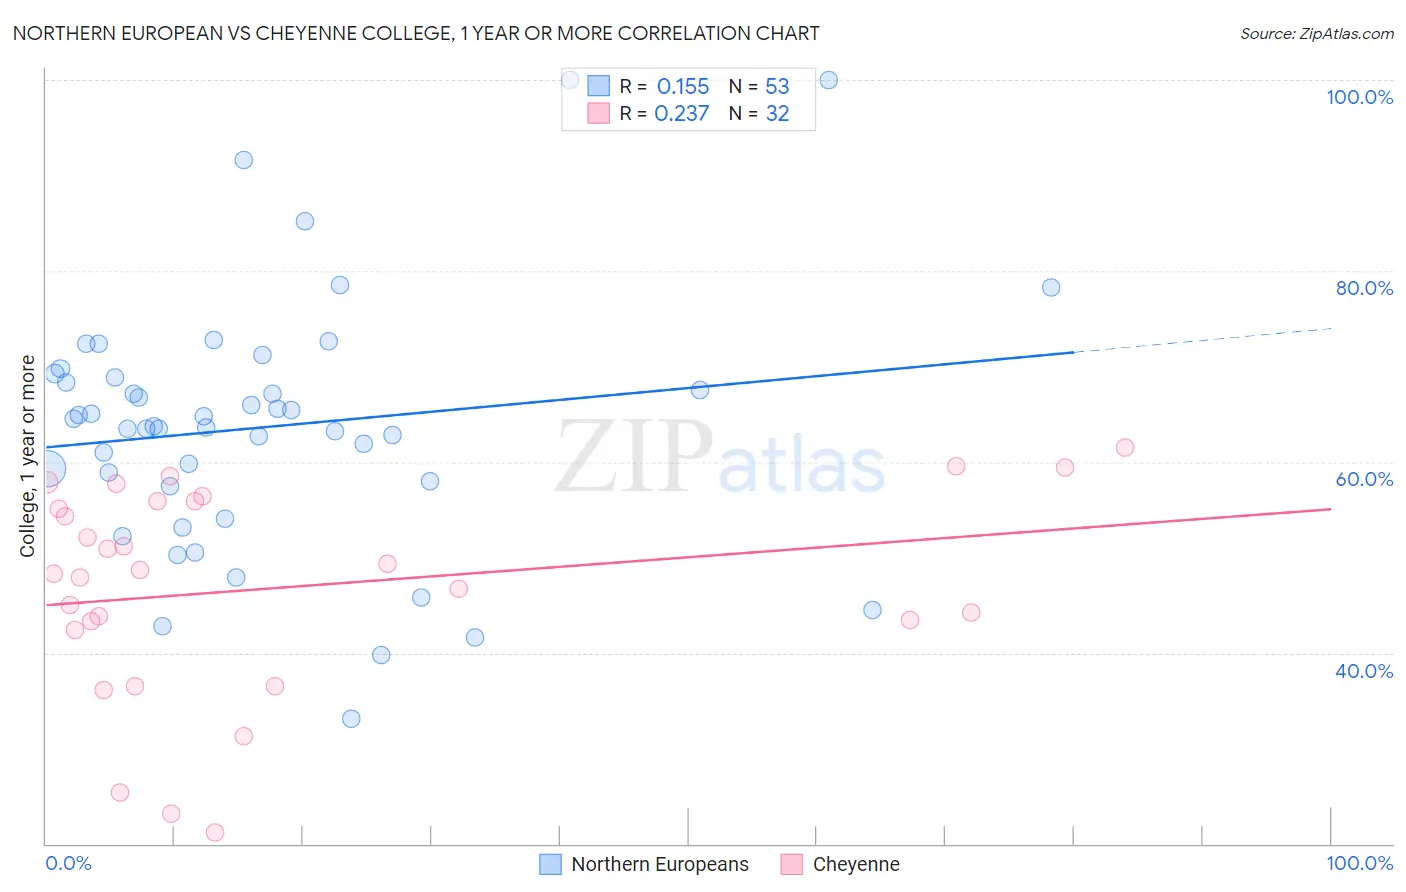
Northern European vs Cheyenne College, 1 year or more Correlation Chart
The statistical analysis conducted on geographies consisting of 406,096,233 people shows a poor positive correlation between the proportion of Northern Europeans and percentage of population with at least college, 1 year or more education in the United States with a correlation coefficient (R) of 0.155 and weighted average of 62.9%. Similarly, the statistical analysis conducted on geographies consisting of 80,719,187 people shows a weak positive correlation between the proportion of Cheyenne and percentage of population with at least college, 1 year or more education in the United States with a correlation coefficient (R) of 0.237 and weighted average of 54.1%, a difference of 16.2%.
College, 1 year or more Correlation Summary
| Measurement | Northern European | Cheyenne |
| Minimum | 33.1% | 21.1% |
| Maximum | 100.0% | 61.5% |
| Range | 66.9% | 40.3% |
| Mean | 63.7% | 46.8% |
| Median | 63.7% | 48.5% |
| Interquartile 25% (IQ1) | 57.7% | 42.9% |
| Interquartile 75% (IQ3) | 69.0% | 55.9% |
| Interquartile Range (IQR) | 11.3% | 13.0% |
| Standard Deviation (Sample) | 13.2% | 10.9% |
| Standard Deviation (Population) | 13.1% | 10.7% |
Similar Demographics by College, 1 year or more
Demographics Similar to Northern Europeans by College, 1 year or more
In terms of college, 1 year or more, the demographic groups most similar to Northern Europeans are Immigrants from Lebanon (62.9%, a difference of 0.010%), Paraguayan (62.9%, a difference of 0.030%), Ethiopian (62.9%, a difference of 0.030%), Lithuanian (62.9%, a difference of 0.040%), and Laotian (62.8%, a difference of 0.090%).
| Demographics | Rating | Rank | College, 1 year or more |
| Egyptians | 99.0 /100 | #72 | Exceptional 63.1% |
| Immigrants | Moldova | 99.0 /100 | #73 | Exceptional 63.0% |
| Immigrants | North America | 99.0 /100 | #74 | Exceptional 63.0% |
| Armenians | 98.9 /100 | #75 | Exceptional 63.0% |
| Paraguayans | 98.8 /100 | #76 | Exceptional 62.9% |
| Ethiopians | 98.8 /100 | #77 | Exceptional 62.9% |
| Immigrants | Lebanon | 98.8 /100 | #78 | Exceptional 62.9% |
| Northern Europeans | 98.8 /100 | #79 | Exceptional 62.9% |
| Lithuanians | 98.8 /100 | #80 | Exceptional 62.9% |
| Laotians | 98.7 /100 | #81 | Exceptional 62.8% |
| Immigrants | Bolivia | 98.7 /100 | #82 | Exceptional 62.8% |
| Immigrants | Argentina | 98.6 /100 | #83 | Exceptional 62.8% |
| Immigrants | England | 98.6 /100 | #84 | Exceptional 62.8% |
| Immigrants | Pakistan | 98.6 /100 | #85 | Exceptional 62.8% |
| Immigrants | Western Europe | 98.6 /100 | #86 | Exceptional 62.7% |
Demographics Similar to Cheyenne by College, 1 year or more
In terms of college, 1 year or more, the demographic groups most similar to Cheyenne are Colville (54.1%, a difference of 0.010%), Guyanese (54.1%, a difference of 0.050%), Arapaho (54.1%, a difference of 0.060%), Immigrants from Jamaica (54.2%, a difference of 0.070%), and Ecuadorian (54.3%, a difference of 0.39%).
| Demographics | Rating | Rank | College, 1 year or more |
| Immigrants | Grenada | 0.2 /100 | #273 | Tragic 54.4% |
| Belizeans | 0.2 /100 | #274 | Tragic 54.4% |
| Americans | 0.2 /100 | #275 | Tragic 54.4% |
| Shoshone | 0.2 /100 | #276 | Tragic 54.3% |
| Ecuadorians | 0.2 /100 | #277 | Tragic 54.3% |
| Immigrants | Jamaica | 0.1 /100 | #278 | Tragic 54.2% |
| Arapaho | 0.1 /100 | #279 | Tragic 54.1% |
| Cheyenne | 0.1 /100 | #280 | Tragic 54.1% |
| Colville | 0.1 /100 | #281 | Tragic 54.1% |
| Guyanese | 0.1 /100 | #282 | Tragic 54.1% |
| Nicaraguans | 0.1 /100 | #283 | Tragic 53.9% |
| Ute | 0.1 /100 | #284 | Tragic 53.8% |
| Immigrants | Guyana | 0.1 /100 | #285 | Tragic 53.5% |
| Central American Indians | 0.1 /100 | #286 | Tragic 53.5% |
| Immigrants | Belize | 0.1 /100 | #287 | Tragic 53.5% |