Immigrants from Colombia vs Cheyenne Unemployment Among Ages 16 to 19 years

COMPARE

Immigrants from Colombia
Race
Ancestry
AfghanAfricanAlaska NativeAlaskan AthabascanAlbanianAleutAlsatianAmericanApacheArabArapahoArgentineanArmenianAssyrian/Chaldean/SyriacAustralianAustrianBahamianBangladeshiBarbadianBasqueBelgianBelizeanBermudanBhutaneseBlackfeetBolivianBrazilianBritishBritish West IndianBulgarianBurmeseCajunCambodianCanadianCape VerdeanCarpatho RusynCelticCentral AmericanCentral American IndianCherokeeChickasawChileanChineseChippewaChoctawColombianColvilleComancheCosta RicanCreeCreekCroatianCrowCubanCypriotCzechCzechoslovakianDanishDelawareDominicanDutchDutch West IndianEastern EuropeanEcuadorianEgyptianEnglishEstonianEthiopianEuropeanFijianFilipinoFinnishFrenchFrench American IndianFrench CanadianGermanGerman RussianGhanaianGreekGuamanian/ChamorroGuatemalanGuyaneseHaitianHmongHonduranHopiHoumaHungarianIcelanderIndian (Asian)IndonesianInupiatIranianIraqiIrishIroquoisIsraeliItalianJamaicanJapaneseJordanianKenyanKiowaKoreanLaotianLatvianLebaneseLiberianLithuanianLumbeeLuxembourgerMacedonianMalaysianMalteseMarshalleseMenomineeMexicanMexican American IndianMongolianMoroccanNative HawaiianNavajoNepaleseNew ZealanderNicaraguanNigerianNorthern EuropeanNorwegianOkinawanOsageOttawaPaiutePakistaniPalestinianPanamanianParaguayanPennsylvania GermanPeruvianPimaPolishPortuguesePotawatomiPuebloPuerto RicanPuget Sound SalishRomanianRussianSalvadoranSamoanScandinavianScotch-IrishScottishSeminoleSenegaleseSerbianShoshoneSierra LeoneanSiouxSlavicSlovakSloveneSomaliSouth AfricanSouth AmericanSouth American IndianSoviet UnionSpaniardSpanishSpanish AmericanSpanish American IndianSri LankanSubsaharan AfricanSudaneseSwedishSwissSyrianTaiwaneseThaiTlingit-HaidaTohono O'OdhamTonganTrinidadian and TobagonianTsimshianTurkishU.S. Virgin IslanderUgandanUkrainianUruguayanUteVenezuelanVietnameseWelshWest IndianYakamaYaquiYugoslavianYumanYup'ikZimbabwean
Immigration
NonimmigrantsImmigrantsAfghanistanAfricaAlbaniaArgentinaArmeniaAsiaAustraliaAustriaBahamasBangladeshBarbadosBelarusBelgiumBelizeBoliviaBosnia and HerzegovinaBrazilBulgariaBurma/MyanmarCabo VerdeCambodiaCameroonCanadaCaribbeanCentral AmericaChileChinaColombiaCongoCosta RicaCroatiaCubaCzechoslovakiaDenmarkDominicaDominican RepublicEastern AfricaEastern AsiaEastern EuropeEcuadorEgyptEl SalvadorEnglandEritreaEthiopiaEuropeFijiFranceGermanyGhanaGreeceGrenadaGuatemalaGuyanaHaitiHondurasHong KongHungaryIndiaIndonesiaIranIraqIrelandIsraelItalyJamaicaJapanJordanKazakhstanKenyaKoreaKuwaitLaosLatin AmericaLatviaLebanonLiberiaLithuaniaMalaysiaMexicoMicronesiaMiddle AfricaMoldovaMoroccoNepalNetherlandsNicaraguaNigeriaNorth AmericaNorth MacedoniaNorthern AfricaNorthern EuropeNorwayOceaniaPakistanPanamaPeruPhilippinesPolandPortugalRomaniaRussiaSaudi ArabiaScotlandSenegalSerbiaSierra LeoneSingaporeSomaliaSouth AfricaSouth AmericaSouth Central AsiaSouth Eastern AsiaSouthern EuropeSpainSri LankaSt. Vincent and the GrenadinesSudanSwedenSwitzerlandSyriaTaiwanThailandTrinidad and TobagoTurkeyUgandaUkraineUruguayUzbekistanVenezuelaVietnamWest IndiesWestern AfricaWestern AsiaWestern EuropeYemenZaireZimbabweAzores
Cheyenne
Race
Ancestry
AfghanAfricanAlaska NativeAlaskan AthabascanAlbanianAleutAlsatianAmericanApacheArabArapahoArgentineanArmenianAssyrian/Chaldean/SyriacAustralianAustrianBahamianBangladeshiBarbadianBasqueBelgianBelizeanBermudanBhutaneseBlackfeetBolivianBrazilianBritishBritish West IndianBulgarianBurmeseCajunCambodianCanadianCape VerdeanCarpatho RusynCelticCentral AmericanCentral American IndianCherokeeCheyenneChickasawChileanChineseChippewaChoctawColombianColvilleComancheCosta RicanCreeCreekCroatianCrowCubanCypriotCzechCzechoslovakianDanishDelawareDominicanDutchDutch West IndianEastern EuropeanEcuadorianEgyptianEnglishEstonianEthiopianEuropeanFijianFilipinoFinnishFrenchFrench American IndianFrench CanadianGermanGerman RussianGhanaianGreekGuamanian/ChamorroGuatemalanGuyaneseHaitianHmongHonduranHopiHoumaHungarianIcelanderIndian (Asian)IndonesianInupiatIranianIraqiIrishIroquoisIsraeliItalianJamaicanJapaneseJordanianKenyanKiowaKoreanLaotianLatvianLebaneseLiberianLithuanianLumbeeLuxembourgerMacedonianMalaysianMalteseMarshalleseMenomineeMexicanMexican American IndianMongolianMoroccanNative HawaiianNavajoNepaleseNew ZealanderNicaraguanNigerianNorthern EuropeanNorwegianOkinawanOsageOttawaPaiutePakistaniPalestinianPanamanianParaguayanPennsylvania GermanPeruvianPimaPolishPortuguesePotawatomiPuebloPuerto RicanPuget Sound SalishRomanianRussianSalvadoranSamoanScandinavianScotch-IrishScottishSeminoleSenegaleseSerbianShoshoneSierra LeoneanSiouxSlavicSlovakSloveneSomaliSouth AfricanSouth AmericanSouth American IndianSoviet UnionSpaniardSpanishSpanish AmericanSpanish American IndianSri LankanSubsaharan AfricanSudaneseSwedishSwissSyrianTaiwaneseThaiTlingit-HaidaTohono O'OdhamTonganTrinidadian and TobagonianTsimshianTurkishU.S. Virgin IslanderUgandanUkrainianUruguayanUteVenezuelanVietnameseWelshWest IndianYakamaYaquiYugoslavianYumanYup'ikZimbabwean
Immigration
NonimmigrantsImmigrantsAfghanistanAfricaAlbaniaArgentinaArmeniaAsiaAustraliaAustriaBahamasBangladeshBarbadosBelarusBelgiumBelizeBoliviaBosnia and HerzegovinaBrazilBulgariaBurma/MyanmarCabo VerdeCambodiaCameroonCanadaCaribbeanCentral AmericaChileChinaCongoCosta RicaCroatiaCubaCzechoslovakiaDenmarkDominicaDominican RepublicEastern AfricaEastern AsiaEastern EuropeEcuadorEgyptEl SalvadorEnglandEritreaEthiopiaEuropeFijiFranceGermanyGhanaGreeceGrenadaGuatemalaGuyanaHaitiHondurasHong KongHungaryIndiaIndonesiaIranIraqIrelandIsraelItalyJamaicaJapanJordanKazakhstanKenyaKoreaKuwaitLaosLatin AmericaLatviaLebanonLiberiaLithuaniaMalaysiaMexicoMicronesiaMiddle AfricaMoldovaMoroccoNepalNetherlandsNicaraguaNigeriaNorth AmericaNorth MacedoniaNorthern AfricaNorthern EuropeNorwayOceaniaPakistanPanamaPeruPhilippinesPolandPortugalRomaniaRussiaSaudi ArabiaScotlandSenegalSerbiaSierra LeoneSingaporeSomaliaSouth AfricaSouth AmericaSouth Central AsiaSouth Eastern AsiaSouthern EuropeSpainSri LankaSt. Vincent and the GrenadinesSudanSwedenSwitzerlandSyriaTaiwanThailandTrinidad and TobagoTurkeyUgandaUkraineUruguayUzbekistanVenezuelaVietnamWest IndiesWestern AfricaWestern AsiaWestern EuropeYemenZaireZimbabweAzores
Unemployment Among Ages 16 to 19 years
Income
Poverty
Unemployment
Labor Participation
Family Structure
Vehicle Availability
Education Level
Disability

Unemployment Among Ages 16 to 19 years Comparison

Immigrants from Colombia

Cheyenne

Tragic
Tragic
18.3%
UNEMPLOYMENT AMONG AGES 16 TO 19 YEARS
2.7/ 100
METRIC RATING
236th/ 347
METRIC RANK
22.3%
UNEMPLOYMENT AMONG AGES 16 TO 19 YEARS
0.0/ 100
METRIC RATING
320th/ 347
METRIC RANK

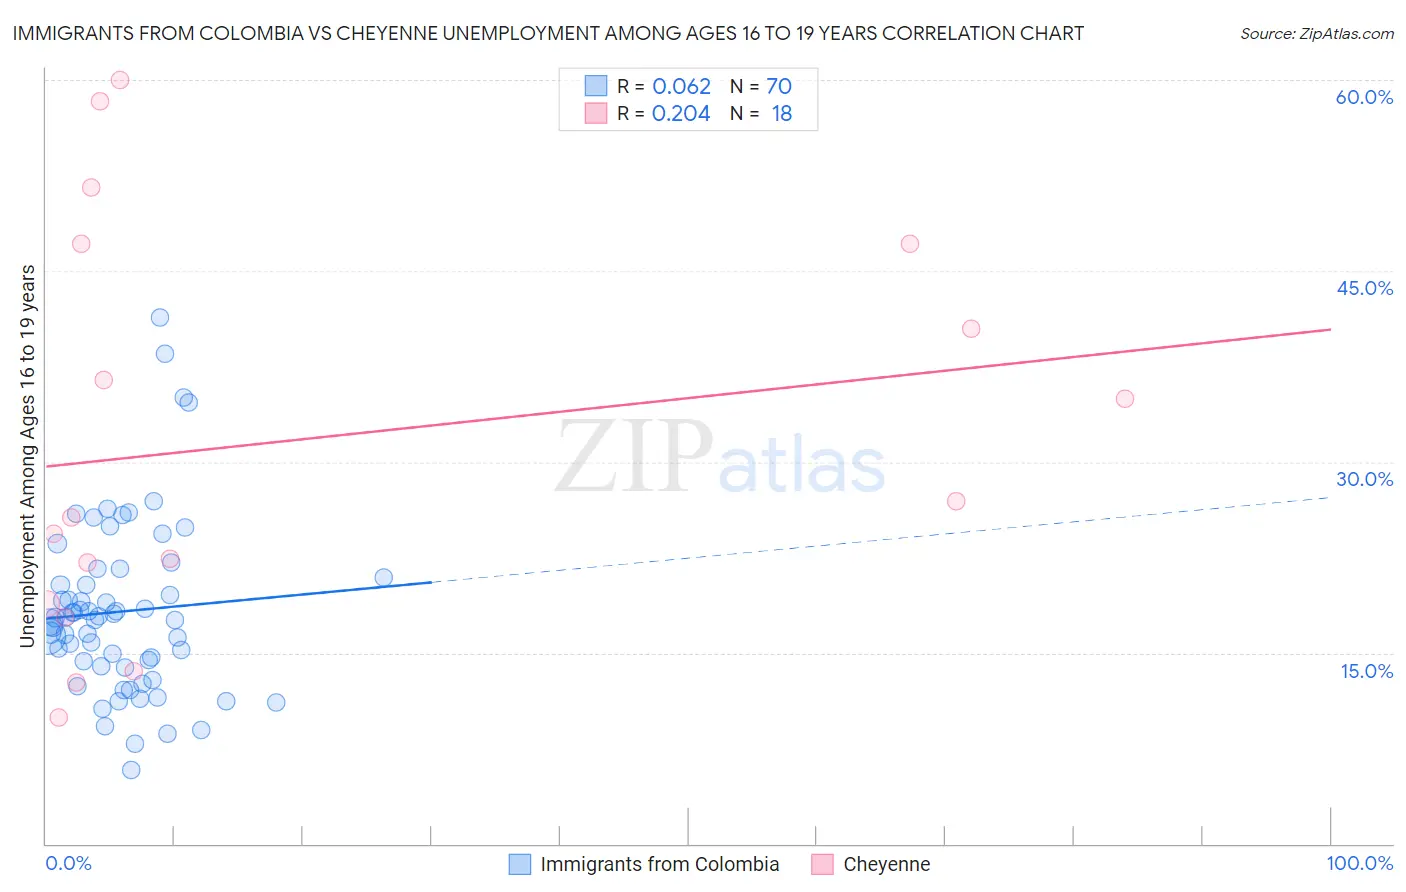
Immigrants from Colombia vs Cheyenne Unemployment Among Ages 16 to 19 years Correlation Chart

The statistical analysis conducted on geographies consisting of 360,806,237 people shows a slight positive correlation between the proportion of Immigrants from Colombia and unemployment rate among population between the ages 16 and 19 in the United States with a correlation coefficient (R) of 0.062 and weighted average of 18.3%. Similarly, the statistical analysis conducted on geographies consisting of 79,316,787 people shows a weak positive correlation between the proportion of Cheyenne and unemployment rate among population between the ages 16 and 19 in the United States with a correlation coefficient (R) of 0.204 and weighted average of 22.3%, a difference of 21.6%.
Immigrants from Colombia vs Cheyenne Unemployment Among Ages 16 to 19 years

Unemployment Among Ages 16 to 19 years Correlation Summary

MeasurementImmigrants from ColombiaCheyenne
Minimum5.8%9.9%
Maximum41.3%60.0%
Range35.6%50.1%
Mean18.2%31.7%
Median17.7%26.3%
Interquartile 25% (IQ1)13.9%18.9%
Interquartile 75% (IQ3)20.9%47.1%
Interquartile Range (IQR)7.0%28.2%
Standard Deviation (Sample)6.8%15.9%
Standard Deviation (Population)6.8%15.5%

Similar Demographics by Unemployment Among Ages 16 to 19 years

Demographics Similar to Immigrants from Colombia by Unemployment Among Ages 16 to 19 years

In terms of unemployment among ages 16 to 19 years, the demographic groups most similar to Immigrants from Colombia are Immigrants (18.3%, a difference of 0.020%), South American (18.3%, a difference of 0.030%), French American Indian (18.3%, a difference of 0.070%), Native Hawaiian (18.3%, a difference of 0.11%), and Immigrants from Cabo Verde (18.4%, a difference of 0.33%).
DemographicsRating | RankUnemployment Among Ages 16 to 19 years
Albanians
5.8
/100
|
#229
Tragic
18.2%
Spanish Americans
4.7
/100
|
#230
Tragic
18.2%
Nepalese
4.2
/100
|
#231
Tragic
18.2%
Immigrants | Russia
4.0
/100
|
#232
Tragic
18.2%
Seminole
4.0
/100
|
#233
Tragic
18.2%
Colombians
3.7
/100
|
#234
Tragic
18.3%
French American Indians
2.9
/100
|
#235
Tragic
18.3%
Immigrants | Colombia
2.7
/100
|
#236
Tragic
18.3%
Immigrants | Immigrants
2.7
/100
|
#237
Tragic
18.3%
South Americans
2.6
/100
|
#238
Tragic
18.3%
Native Hawaiians
2.4
/100
|
#239
Tragic
18.3%
Immigrants | Cabo Verde
2.0
/100
|
#240
Tragic
18.4%
Immigrants | Ukraine
1.3
/100
|
#241
Tragic
18.5%
Moroccans
1.1
/100
|
#242
Tragic
18.5%
Mexicans
0.9
/100
|
#243
Tragic
18.5%

Demographics Similar to Cheyenne by Unemployment Among Ages 16 to 19 years

In terms of unemployment among ages 16 to 19 years, the demographic groups most similar to Cheyenne are Immigrants from West Indies (22.2%, a difference of 0.23%), Immigrants from Jamaica (22.2%, a difference of 0.39%), Immigrants from Belize (22.2%, a difference of 0.54%), West Indian (22.4%, a difference of 0.70%), and Barbadian (22.5%, a difference of 0.83%).
DemographicsRating | RankUnemployment Among Ages 16 to 19 years
Jamaicans
0.0
/100
|
#313
Tragic
21.7%
Alaska Natives
0.0
/100
|
#314
Tragic
21.8%
Immigrants | Dominica
0.0
/100
|
#315
Tragic
21.9%
Tohono O'odham
0.0
/100
|
#316
Tragic
22.1%
Immigrants | Belize
0.0
/100
|
#317
Tragic
22.2%
Immigrants | Jamaica
0.0
/100
|
#318
Tragic
22.2%
Immigrants | West Indies
0.0
/100
|
#319
Tragic
22.2%
Cheyenne
0.0
/100
|
#320
Tragic
22.3%
West Indians
0.0
/100
|
#321
Tragic
22.4%
Barbadians
0.0
/100
|
#322
Tragic
22.5%
Yakama
0.0
/100
|
#323
Tragic
22.5%
Immigrants | Armenia
0.0
/100
|
#324
Tragic
22.6%
Trinidadians and Tobagonians
0.0
/100
|
#325
Tragic
22.6%
Immigrants | Trinidad and Tobago
0.0
/100
|
#326
Tragic
23.1%
Pima
0.0
/100
|
#327
Tragic
23.1%