Immigrants from Colombia vs Pueblo College, 1 year or more
COMPARE
Immigrants from Colombia
Pueblo
College, 1 year or more
College, 1 year or more Comparison
Immigrants from Colombia
Pueblo
57.8%
COLLEGE, 1 YEAR OR MORE
11.6/ 100
METRIC RATING
214th/ 347
METRIC RANK
51.5%
COLLEGE, 1 YEAR OR MORE
0.0/ 100
METRIC RATING
312th/ 347
METRIC RANK
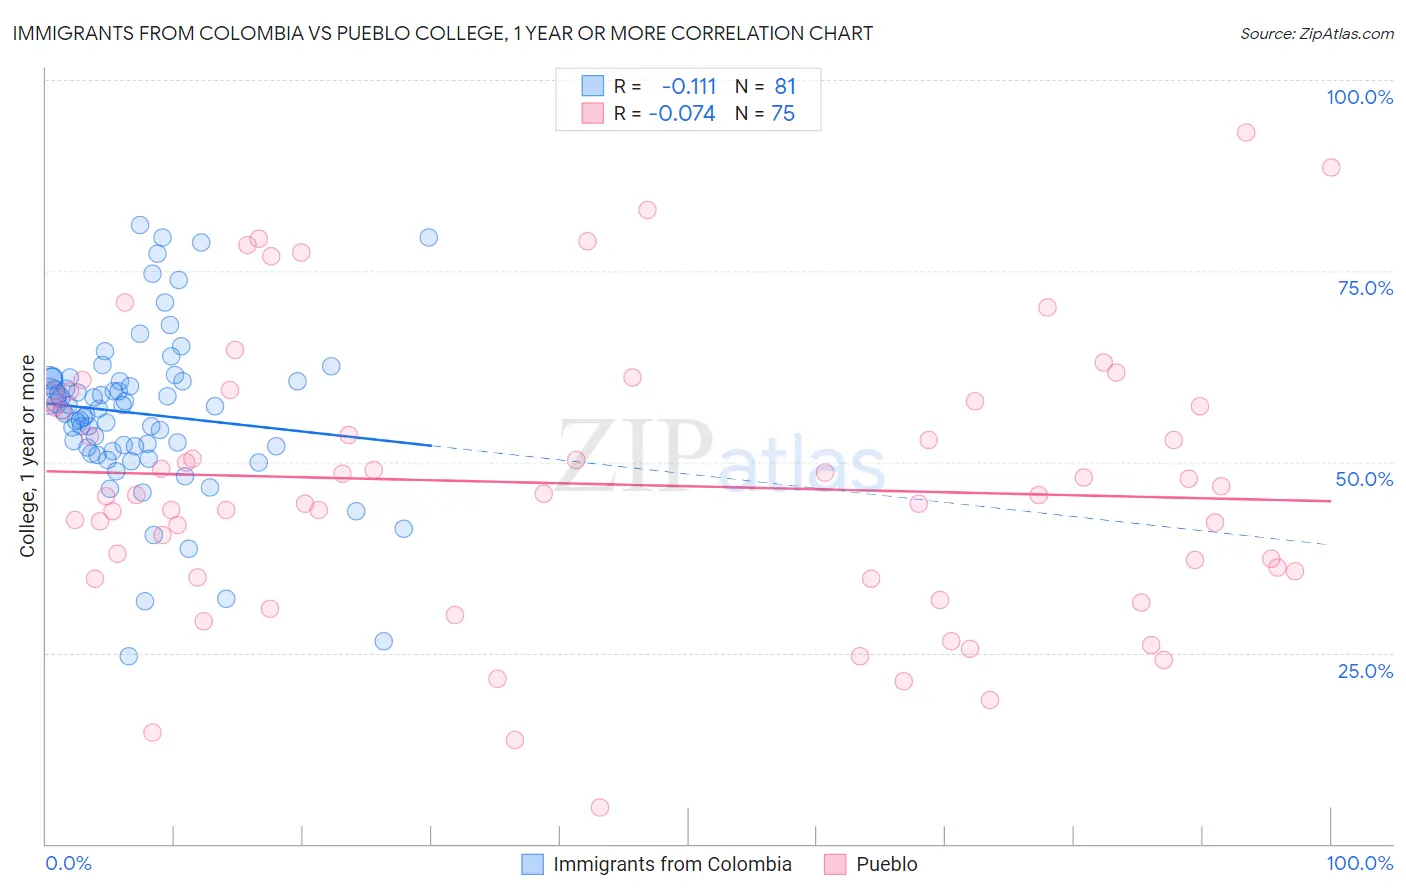
Immigrants from Colombia vs Pueblo College, 1 year or more Correlation Chart
The statistical analysis conducted on geographies consisting of 378,687,641 people shows a poor negative correlation between the proportion of Immigrants from Colombia and percentage of population with at least college, 1 year or more education in the United States with a correlation coefficient (R) of -0.111 and weighted average of 57.8%. Similarly, the statistical analysis conducted on geographies consisting of 120,087,269 people shows a slight negative correlation between the proportion of Pueblo and percentage of population with at least college, 1 year or more education in the United States with a correlation coefficient (R) of -0.074 and weighted average of 51.5%, a difference of 12.3%.
College, 1 year or more Correlation Summary
| Measurement | Immigrants from Colombia | Pueblo |
| Minimum | 24.6% | 4.8% |
| Maximum | 81.0% | 93.1% |
| Range | 56.4% | 88.3% |
| Mean | 56.3% | 47.1% |
| Median | 57.0% | 45.6% |
| Interquartile 25% (IQ1) | 51.7% | 34.9% |
| Interquartile 75% (IQ3) | 60.7% | 57.9% |
| Interquartile Range (IQR) | 9.0% | 23.0% |
| Standard Deviation (Sample) | 10.7% | 18.1% |
| Standard Deviation (Population) | 10.6% | 18.0% |
Similar Demographics by College, 1 year or more
Demographics Similar to Immigrants from Colombia by College, 1 year or more
In terms of college, 1 year or more, the demographic groups most similar to Immigrants from Colombia are Tongan (57.8%, a difference of 0.0%), Immigrants from Senegal (57.8%, a difference of 0.030%), French Canadian (57.8%, a difference of 0.030%), Immigrants from Peru (57.7%, a difference of 0.14%), and Immigrants from Nigeria (57.9%, a difference of 0.21%).
| Demographics | Rating | Rank | College, 1 year or more |
| Senegalese | 16.9 /100 | #207 | Poor 58.2% |
| Immigrants | Uruguay | 15.2 /100 | #208 | Poor 58.1% |
| Immigrants | Middle Africa | 14.0 /100 | #209 | Poor 58.0% |
| Tsimshian | 13.5 /100 | #210 | Poor 57.9% |
| Immigrants | Nigeria | 13.3 /100 | #211 | Poor 57.9% |
| Immigrants | Senegal | 11.8 /100 | #212 | Poor 57.8% |
| French Canadians | 11.8 /100 | #213 | Poor 57.8% |
| Immigrants | Colombia | 11.6 /100 | #214 | Poor 57.8% |
| Tongans | 11.6 /100 | #215 | Poor 57.8% |
| Immigrants | Peru | 10.6 /100 | #216 | Poor 57.7% |
| Immigrants | Panama | 9.1 /100 | #217 | Tragic 57.6% |
| Native Hawaiians | 9.0 /100 | #218 | Tragic 57.6% |
| Whites/Caucasians | 8.7 /100 | #219 | Tragic 57.6% |
| Immigrants | Costa Rica | 8.0 /100 | #220 | Tragic 57.5% |
| Immigrants | Ghana | 7.7 /100 | #221 | Tragic 57.4% |
Demographics Similar to Pueblo by College, 1 year or more
In terms of college, 1 year or more, the demographic groups most similar to Pueblo are Immigrants from Haiti (51.5%, a difference of 0.040%), Immigrants from Caribbean (51.4%, a difference of 0.13%), Honduran (51.6%, a difference of 0.20%), Fijian (51.3%, a difference of 0.35%), and Guatemalan (51.2%, a difference of 0.58%).
| Demographics | Rating | Rank | College, 1 year or more |
| Seminole | 0.0 /100 | #305 | Tragic 52.1% |
| Mexican American Indians | 0.0 /100 | #306 | Tragic 51.9% |
| Immigrants | Portugal | 0.0 /100 | #307 | Tragic 51.9% |
| Salvadorans | 0.0 /100 | #308 | Tragic 51.8% |
| Apache | 0.0 /100 | #309 | Tragic 51.8% |
| Hondurans | 0.0 /100 | #310 | Tragic 51.6% |
| Immigrants | Haiti | 0.0 /100 | #311 | Tragic 51.5% |
| Pueblo | 0.0 /100 | #312 | Tragic 51.5% |
| Immigrants | Caribbean | 0.0 /100 | #313 | Tragic 51.4% |
| Fijians | 0.0 /100 | #314 | Tragic 51.3% |
| Guatemalans | 0.0 /100 | #315 | Tragic 51.2% |
| Cajuns | 0.0 /100 | #316 | Tragic 51.2% |
| Hispanics or Latinos | 0.0 /100 | #317 | Tragic 51.1% |
| Immigrants | Honduras | 0.0 /100 | #318 | Tragic 51.0% |
| Immigrants | El Salvador | 0.0 /100 | #319 | Tragic 51.0% |