Chippewa vs Cheyenne College, 1 year or more
COMPARE
Chippewa
Cheyenne
College, 1 year or more
College, 1 year or more Comparison
Chippewa
Cheyenne
55.7%
COLLEGE, 1 YEAR OR MORE
0.9/ 100
METRIC RATING
244th/ 347
METRIC RANK
54.1%
COLLEGE, 1 YEAR OR MORE
0.1/ 100
METRIC RATING
280th/ 347
METRIC RANK
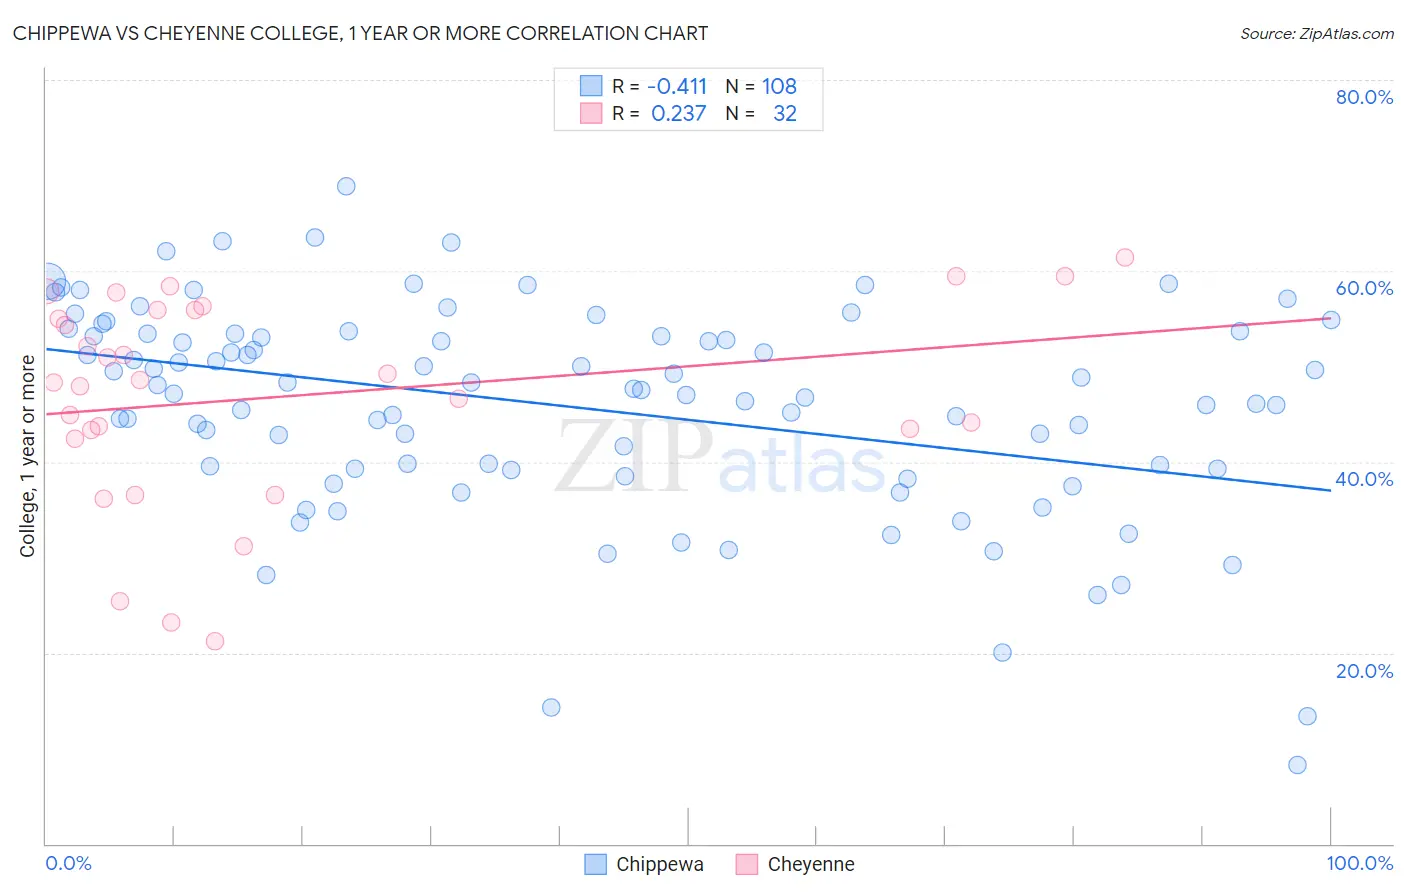
Chippewa vs Cheyenne College, 1 year or more Correlation Chart
The statistical analysis conducted on geographies consisting of 215,068,137 people shows a moderate negative correlation between the proportion of Chippewa and percentage of population with at least college, 1 year or more education in the United States with a correlation coefficient (R) of -0.411 and weighted average of 55.7%. Similarly, the statistical analysis conducted on geographies consisting of 80,719,187 people shows a weak positive correlation between the proportion of Cheyenne and percentage of population with at least college, 1 year or more education in the United States with a correlation coefficient (R) of 0.237 and weighted average of 54.1%, a difference of 2.9%.
College, 1 year or more Correlation Summary
| Measurement | Chippewa | Cheyenne |
| Minimum | 8.2% | 21.1% |
| Maximum | 68.9% | 61.5% |
| Range | 60.6% | 40.3% |
| Mean | 45.8% | 46.8% |
| Median | 47.6% | 48.5% |
| Interquartile 25% (IQ1) | 39.3% | 42.9% |
| Interquartile 75% (IQ3) | 53.4% | 55.9% |
| Interquartile Range (IQR) | 14.2% | 13.0% |
| Standard Deviation (Sample) | 11.1% | 10.9% |
| Standard Deviation (Population) | 11.0% | 10.7% |
Similar Demographics by College, 1 year or more
Demographics Similar to Chippewa by College, 1 year or more
In terms of college, 1 year or more, the demographic groups most similar to Chippewa are Immigrants from Liberia (55.7%, a difference of 0.070%), Malaysian (55.6%, a difference of 0.11%), Osage (55.8%, a difference of 0.12%), Marshallese (55.8%, a difference of 0.13%), and Hawaiian (55.6%, a difference of 0.19%).
| Demographics | Rating | Rank | College, 1 year or more |
| Samoans | 1.6 /100 | #237 | Tragic 56.2% |
| Barbadians | 1.3 /100 | #238 | Tragic 56.0% |
| Puget Sound Salish | 1.1 /100 | #239 | Tragic 55.9% |
| Trinidadians and Tobagonians | 1.1 /100 | #240 | Tragic 55.8% |
| French American Indians | 1.0 /100 | #241 | Tragic 55.8% |
| Marshallese | 1.0 /100 | #242 | Tragic 55.8% |
| Osage | 1.0 /100 | #243 | Tragic 55.8% |
| Chippewa | 0.9 /100 | #244 | Tragic 55.7% |
| Immigrants | Liberia | 0.8 /100 | #245 | Tragic 55.7% |
| Malaysians | 0.8 /100 | #246 | Tragic 55.6% |
| Hawaiians | 0.8 /100 | #247 | Tragic 55.6% |
| Immigrants | Congo | 0.8 /100 | #248 | Tragic 55.6% |
| Immigrants | Trinidad and Tobago | 0.7 /100 | #249 | Tragic 55.5% |
| Delaware | 0.7 /100 | #250 | Tragic 55.5% |
| Immigrants | Cambodia | 0.6 /100 | #251 | Tragic 55.4% |
Demographics Similar to Cheyenne by College, 1 year or more
In terms of college, 1 year or more, the demographic groups most similar to Cheyenne are Colville (54.1%, a difference of 0.010%), Guyanese (54.1%, a difference of 0.050%), Arapaho (54.1%, a difference of 0.060%), Immigrants from Jamaica (54.2%, a difference of 0.070%), and Ecuadorian (54.3%, a difference of 0.39%).
| Demographics | Rating | Rank | College, 1 year or more |
| Immigrants | Grenada | 0.2 /100 | #273 | Tragic 54.4% |
| Belizeans | 0.2 /100 | #274 | Tragic 54.4% |
| Americans | 0.2 /100 | #275 | Tragic 54.4% |
| Shoshone | 0.2 /100 | #276 | Tragic 54.3% |
| Ecuadorians | 0.2 /100 | #277 | Tragic 54.3% |
| Immigrants | Jamaica | 0.1 /100 | #278 | Tragic 54.2% |
| Arapaho | 0.1 /100 | #279 | Tragic 54.1% |
| Cheyenne | 0.1 /100 | #280 | Tragic 54.1% |
| Colville | 0.1 /100 | #281 | Tragic 54.1% |
| Guyanese | 0.1 /100 | #282 | Tragic 54.1% |
| Nicaraguans | 0.1 /100 | #283 | Tragic 53.9% |
| Ute | 0.1 /100 | #284 | Tragic 53.8% |
| Immigrants | Guyana | 0.1 /100 | #285 | Tragic 53.5% |
| Central American Indians | 0.1 /100 | #286 | Tragic 53.5% |
| Immigrants | Belize | 0.1 /100 | #287 | Tragic 53.5% |