Immigrants from Colombia vs Immigrants from North Macedonia College, 1 year or more
COMPARE
Immigrants from Colombia
Immigrants from North Macedonia
College, 1 year or more
College, 1 year or more Comparison
Immigrants from Colombia
Immigrants from North Macedonia
57.8%
COLLEGE, 1 YEAR OR MORE
11.6/ 100
METRIC RATING
214th/ 347
METRIC RANK
59.5%
COLLEGE, 1 YEAR OR MORE
53.1/ 100
METRIC RATING
167th/ 347
METRIC RANK
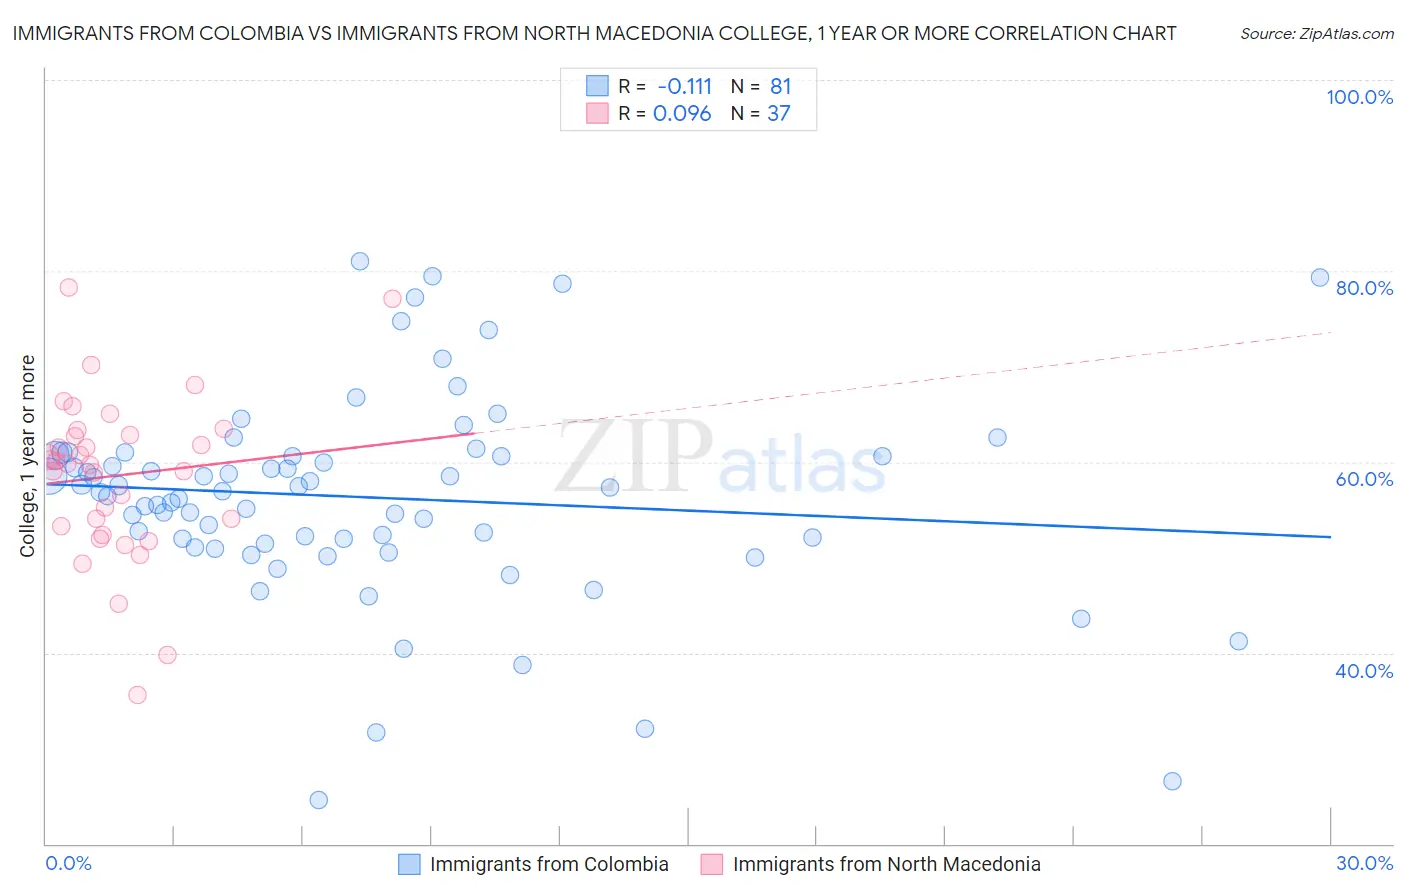
Immigrants from Colombia vs Immigrants from North Macedonia College, 1 year or more Correlation Chart
The statistical analysis conducted on geographies consisting of 378,687,641 people shows a poor negative correlation between the proportion of Immigrants from Colombia and percentage of population with at least college, 1 year or more education in the United States with a correlation coefficient (R) of -0.111 and weighted average of 57.8%. Similarly, the statistical analysis conducted on geographies consisting of 74,317,045 people shows a slight positive correlation between the proportion of Immigrants from North Macedonia and percentage of population with at least college, 1 year or more education in the United States with a correlation coefficient (R) of 0.096 and weighted average of 59.5%, a difference of 2.9%.
College, 1 year or more Correlation Summary
| Measurement | Immigrants from Colombia | Immigrants from North Macedonia |
| Minimum | 24.6% | 35.6% |
| Maximum | 81.0% | 78.3% |
| Range | 56.4% | 42.7% |
| Mean | 56.3% | 58.6% |
| Median | 57.0% | 59.8% |
| Interquartile 25% (IQ1) | 51.7% | 52.8% |
| Interquartile 75% (IQ3) | 60.7% | 63.0% |
| Interquartile Range (IQR) | 9.0% | 10.2% |
| Standard Deviation (Sample) | 10.7% | 8.7% |
| Standard Deviation (Population) | 10.6% | 8.6% |
Similar Demographics by College, 1 year or more
Demographics Similar to Immigrants from Colombia by College, 1 year or more
In terms of college, 1 year or more, the demographic groups most similar to Immigrants from Colombia are Tongan (57.8%, a difference of 0.0%), Immigrants from Senegal (57.8%, a difference of 0.030%), French Canadian (57.8%, a difference of 0.030%), Immigrants from Peru (57.7%, a difference of 0.14%), and Immigrants from Nigeria (57.9%, a difference of 0.21%).
| Demographics | Rating | Rank | College, 1 year or more |
| Senegalese | 16.9 /100 | #207 | Poor 58.2% |
| Immigrants | Uruguay | 15.2 /100 | #208 | Poor 58.1% |
| Immigrants | Middle Africa | 14.0 /100 | #209 | Poor 58.0% |
| Tsimshian | 13.5 /100 | #210 | Poor 57.9% |
| Immigrants | Nigeria | 13.3 /100 | #211 | Poor 57.9% |
| Immigrants | Senegal | 11.8 /100 | #212 | Poor 57.8% |
| French Canadians | 11.8 /100 | #213 | Poor 57.8% |
| Immigrants | Colombia | 11.6 /100 | #214 | Poor 57.8% |
| Tongans | 11.6 /100 | #215 | Poor 57.8% |
| Immigrants | Peru | 10.6 /100 | #216 | Poor 57.7% |
| Immigrants | Panama | 9.1 /100 | #217 | Tragic 57.6% |
| Native Hawaiians | 9.0 /100 | #218 | Tragic 57.6% |
| Whites/Caucasians | 8.7 /100 | #219 | Tragic 57.6% |
| Immigrants | Costa Rica | 8.0 /100 | #220 | Tragic 57.5% |
| Immigrants | Ghana | 7.7 /100 | #221 | Tragic 57.4% |
Demographics Similar to Immigrants from North Macedonia by College, 1 year or more
In terms of college, 1 year or more, the demographic groups most similar to Immigrants from North Macedonia are Hungarian (59.5%, a difference of 0.010%), Immigrants from Southern Europe (59.5%, a difference of 0.020%), Welsh (59.5%, a difference of 0.040%), Immigrants from Albania (59.5%, a difference of 0.040%), and Immigrants from Sierra Leone (59.5%, a difference of 0.050%).
| Demographics | Rating | Rank | College, 1 year or more |
| South American Indians | 66.9 /100 | #160 | Good 60.0% |
| Somalis | 64.5 /100 | #161 | Good 59.9% |
| Koreans | 58.5 /100 | #162 | Average 59.7% |
| Immigrants | Somalia | 58.3 /100 | #163 | Average 59.7% |
| Belgians | 58.1 /100 | #164 | Average 59.7% |
| Irish | 56.1 /100 | #165 | Average 59.6% |
| Immigrants | Africa | 56.1 /100 | #166 | Average 59.6% |
| Immigrants | North Macedonia | 53.1 /100 | #167 | Average 59.5% |
| Hungarians | 52.9 /100 | #168 | Average 59.5% |
| Immigrants | Southern Europe | 52.7 /100 | #169 | Average 59.5% |
| Welsh | 52.4 /100 | #170 | Average 59.5% |
| Immigrants | Albania | 52.3 /100 | #171 | Average 59.5% |
| Immigrants | Sierra Leone | 52.2 /100 | #172 | Average 59.5% |
| Immigrants | Oceania | 51.2 /100 | #173 | Average 59.4% |
| Celtics | 50.0 /100 | #174 | Average 59.4% |